Persistent memory: the six failures that never raise an error
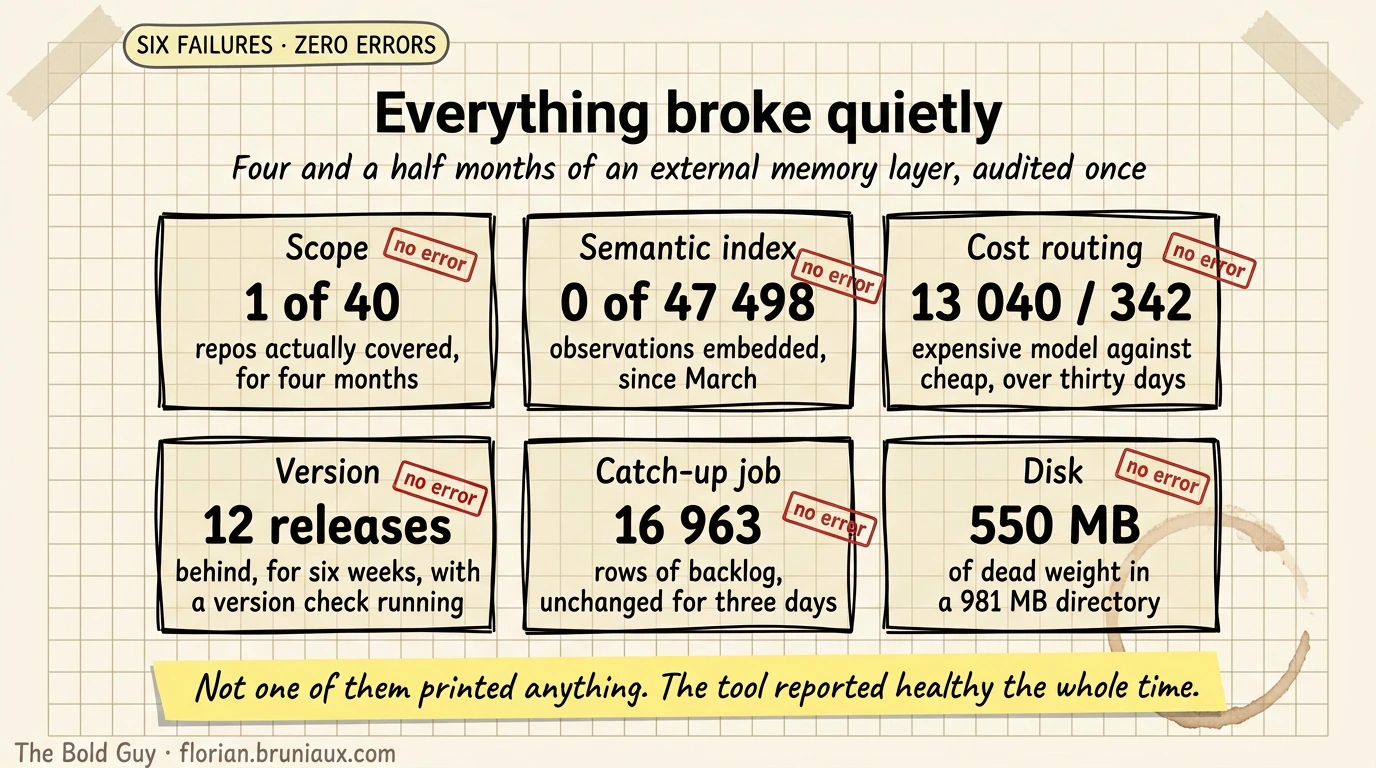
I ran claude-mem for four and a half months. Six things were broken, four of them since March, and none ever raised an error.
Jump to summary
Written by Florian Bruniaux
AI Founding Engineer at Méthode Aristote, 13 years scaling engineering teams from developer to CTO. Builds open-source developer tools, see what else I've shipped.
What you'll set up
- ✓ A decision rule for native memory versus an external layer
- ✓ An external memory layer installed and scoped to every repo, not just one
- ✓ Six checks that expose failures that never raise an error
- ✓ A memory canary that runs in ten seconds
Prerequisites
- → Claude Code installed with a CLAUDE.md (Level 0 of the setup guide)
- → sqlite3 available on the command line
TL;DR
I recommend native memory unless you need to answer “how did we solve this last time” about work you no longer remember doing; short sessions and few projects do not justify an external layer. I keep claude-mem, and what makes that safe for me is a weekly canary, because on my installation six things were broken, four of them since March, and none raised an error. If you run an external layer, check it with active queries on scope, index coverage, cost routing, version, backlog and disk, and do not read a clean error log as proof that it works. This guide covers a single-user local store only; team-shared stores are a separate question I have not assessed.
Your CLAUDE.md can fail to load without saying so. That’s why the setup guide puts a canary line at the top of the file: a missing echo is a failed response check. Loading evidence is needed to establish whether the file was absent.
claude-mem had the same property, but I had no canary for it.
I ran an external memory layer for four and a half months. It produced 49 902 observations, filled 1.6 GB on disk, and looked healthy the entire time. When I finally audited it, six separate things were broken. Four of them had been broken since March. Not one had ever printed an error, degraded a response in a way I’d notice, or shown up in any status output I’d thought to check.
This guide covers the adoption decision, the setup, and the six checks. Each check takes two lines of shell and exposed a failure.
Native memory and its ceiling
Claude Code ships with memory. Project-level context lives under ~/.claude/projects/<project>/memory/, Claude writes to it as it makes discoveries, and it comes back at the start of future sessions. You manage it with /memory. The setup guide’s Level 2 covers what belongs in it.
Three properties define what it can and cannot do.
It’s capped. The MEMORY.md index is limited to 200 lines, enforced at read time. Store conventions there rather than in CLAUDE.md and they will eventually get pruned out from under you.
It’s per-user and never committed. That makes it correct for personal workflow patterns and wrong for team conventions, which belong in CLAUDE.md where the whole team sees them.
Claude writes selected items it judges worth remembering. In my use, that judgment was usually good, so the store held decisions without preserving a complete record of what happened.
An external layer captures every tool call: each Read, Edit, and Bash, compressed by a model into a typed observation and stored in SQLite. Four months of that is an exhaustive log of what you built and why, searchable by keyword and by meaning.
The decision rule is narrow. Take the external layer when you need to answer questions of the form “how did we solve this last time” about work you no longer remember doing. If your sessions are short and your projects few, the native store already covers you and the external layer is 1.6 GB and a compression bill you don’t need.
Shared external stores are a write surface with no meaningful access control in most shipping tools. This guide assumes a single-user local store.
The Memory Systems guide compares native memory, cross-session tools, team sharing, and multi-agent patterns. This guide covers the operational checks for one single-user local claude-mem installation.
Setting it up
The reference implementation below is claude-mem (Apache-2.0). Its commands target claude-mem, while the failure patterns apply more widely.
Two commands inside Claude Code, then restart:
/plugin marketplace add thedotmack/claude-mem
/plugin install claude-mem
Diagnosing one trap takes twenty minutes. npm install -g claude-mem installs the SDK library only. It registers no hooks, starts no worker, and emits no error. Install through /plugin or npx claude-mem install.
Verify the worker is alive:
curl -s http://127.0.0.1:37777/api/health | python3 -m json.toolYou want "status": "ok" and a version number. Settings live in ~/.claude-mem/settings.json. Three worth setting on day one:
{
  "CLAUDE_MEM_SKIP_TOOLS": "ListMcpResourcesTool,SlashCommand,Skill,TodoWrite,AskUserQuestion",
  "CLAUDE_MEM_CONTEXT_OBSERVATIONS": "30",
  "CLAUDE_MEM_EXCLUDED_PROJECTS": "*/scratchpad/*"
}
SKIP_TOOLS drops the tools whose observations teach nothing. CONTEXT_OBSERVATIONS sets how many observations get reinjected each session; 50 costs roughly 22 000 tokens of reading at every startup, and 30 is the better trade. EXCLUDED_PROJECTS keeps temp directories out of the store.
The setting that drives cost is the compression model. Every tool call triggers a model call, billed against your Claude Code quota and invisible in session stats. The default gives precise observations, which is the entire point four months later. A cheaper tier costs less per token and produces coarser ones: at Anthropic’s September 2026 list prices, Haiku 4.5 costs half of Sonnet 5 and a quarter of Opus 5.5. Each observation stores the model that generated it, so you can switch, run a week, and compare rather than guess.
The six silent failures
Each one below is stated as the check that exposes it, because the check is the deliverable. Run all six. On my installation every one of them hit, which is why I run them; yours may differ.
1. It only runs on one repo
The check:
python3 -c "
import json,pathlib
d=json.loads((pathlib.Path.home()/'.claude/settings.json').read_text())
print(d.get('enabledPlugins',{}).get('claude-mem@thedotmack','ABSENT'))"
True means it runs everywhere. ABSENT means it runs, at best, on the individual projects whose own .claude/settings.json enables it.
What I found: ABSENT. I had enabled the plugin in exactly one project file, on my main work repo. It had run there since March, accumulating 47 498 observations, while 39 personal repos and every client repo produced nothing. The store had a handful of stray observations from other projects, the most recent dated 23 June, seven weeks before the audit.
Why it’s silent: a plugin scoped to a project behaves identically to one scoped globally from inside that project. Every session I ran was in the repo where it worked. The failure appears only when you compare that repo with the ones where claude-mem is inactive.
The fix is one line, and /plugin install writes it for you at user scope. What it will not do is retroactively fix a project-scoped install you did months ago.
2. The semantic index is empty
An external memory layer usually runs two search paths: full-text over the raw content, and vector search over embeddings. The full-text path is cheap and always works. The vector path is what makes “how did we solve this” work when you don’t remember the words you used.
The check:
DB=~/.claude-mem/claude-mem.db; VEC=~/.claude-mem/chroma/chroma.sqlite3
q() { sqlite3 "$VEC" "SELECT COUNT(*) FROM embedding_metadata WHERE key='$1' AND string_value='$2';"; }
echo "observations $(sqlite3 $DB 'SELECT COUNT(*) FROM observations;') / $(q field_type narrative)"
echo "summaries    $(sqlite3 $DB 'SELECT COUNT(*) FROM session_summaries;') / $(q field_type request)"
echo "prompts      $(sqlite3 $DB 'SELECT COUNT(*) FROM user_prompts;') / $(q doc_type user_prompt)"
Each line reads stored over indexed, and the two should be close.
Note the third line uses a different key. An observation gets one narrative embedding and a summary gets one request embedding, but prompt documents carry no field_type at all, so they have to be counted by doc_type instead. I first used the same query pattern and it reported zero indexed prompts, which would have sent me hunting a failure that didn’t exist. Inspect claude-mem’s metadata labels before trusting a check that assumes a pattern.
Check observations, session summaries, and prompts. I audited the observation count alone for two days and concluded a backfill had stalled, while claude-mem was working through summaries and prompts the entire time. Those two tables carried their own months-long backlog, and a single-table check is blind to it by construction.
What I found: claude-mem had stored 47 498 observations but embedded none. It had indexed session summaries and prompts in the thousands, leaving four months of semantic search to query an empty observation collection.
Why it’s silent: full-text search kept returning results, hiding the loss of semantic recall. Semantic recall has no ground truth you can eyeball, so the results still looked plausible.
Two false leads cost me an hour because they look like reasonable checks.
In claude-mem’s default local mode, the vector store runs as a subprocess over stdio, and the HOST and PORT settings apply only to remote mode. A curl against the port fails identically on a healthy install and a broken one, which makes it worse than no check at all. Use claude-mem’s own probe instead:
curl -s "http://127.0.0.1:37777/api/chroma/status?deep=1" | python3 -m json.toolThat runs a full search round-trip and reports latency. Mine came back healthy in 56 ms while the collection sat empty. The probe measures only whether search is available.
chroma-sync-state.json holds a watermark per project, the highest row id the sync believes it has handled. Summing those watermarks gave me 1 876 794 for 49 217 stored observations, an invalid comparison. Per project, the watermark is the file that reveals the failure in #5.
3. Cost routing never fires
Tiered routing sends cheap work to a cheap model and keeps the expensive one for work that needs it. Mine was enabled, with both tiers pointed at the cheap model.
The check:
sqlite3 ~/.claude-mem/claude-mem.db \
  "SELECT generated_by_model, COUNT(*) FROM observations
   WHERE created_at > date('now','-7 days') GROUP BY 1;"
What I found: 4 484 observations on the expensive model against 217 on the cheap one over seven days. Over thirty days, 13 040 against 342.
Why it’s silent: the routing worked exactly as written. Reading the source at SessionRoutes.ts:664, the cheap tier is selected only when every message in the pending buffer is an observation whose tool is one of Read, Glob, Grep, LS, ListMcpResourcesTool. A single Edit, Write, or Bash anywhere in the batch sends the whole batch to the default model. In a real editing session that condition is almost never true.
claude-mem’s routing follows its documented condition, so there is no bug to file. In an editing session, that condition leaves the default model as the setting that governs the bill; the tiering config has no practical effect.
Compare the configured routes with the generated_by_model counts. A valid configuration can still route no batches to the cheap model.
4. Twelve releases behind
The check:
curl -s http://127.0.0.1:37777/api/health | python3 -c "import json,sys; print(json.load(sys.stdin)['version'])"
npm view claude-mem version
What I found: 13.9.2 running, pinned to a commit from 30 June. Latest was 13.15.0. Twelve releases, six weeks, no notification of any kind, despite a version-check script running as a Setup hook on every single session.
Why it matters more than usual: updating fixed failure #2 outright. The version bump triggered a backfill that started embedding four months of observations that had never been indexed. I had been preparing to debug a June build.
Before debugging a plugin, check its version. I skipped that check for six weeks.
5. The catch-up trusts a watermark it never verifies
Failure #5 became visible only after fixing #4.
The update kicked off a backfill. It reached about 65 percent and stopped. I assumed it was still running, since the database file kept getting written to every minute.
The check is the same as #2, run twice a day apart. Compare the gap.
What I found:
| Day 1 | Day 2 | Delta | |
|---|---|---|---|
| Observations stored | 49 217 | 49 343 | +126 |
| Observations indexed | 32 254 | 32 380 | +126 |
| Gap | 16 963 | 16 963 | 0 |
The observation gap was identical on both days. Session summaries showed the same frozen gap, 2 104 both days. Prompts did too, at 5 482. All three gaps stayed unchanged over 24 hours.
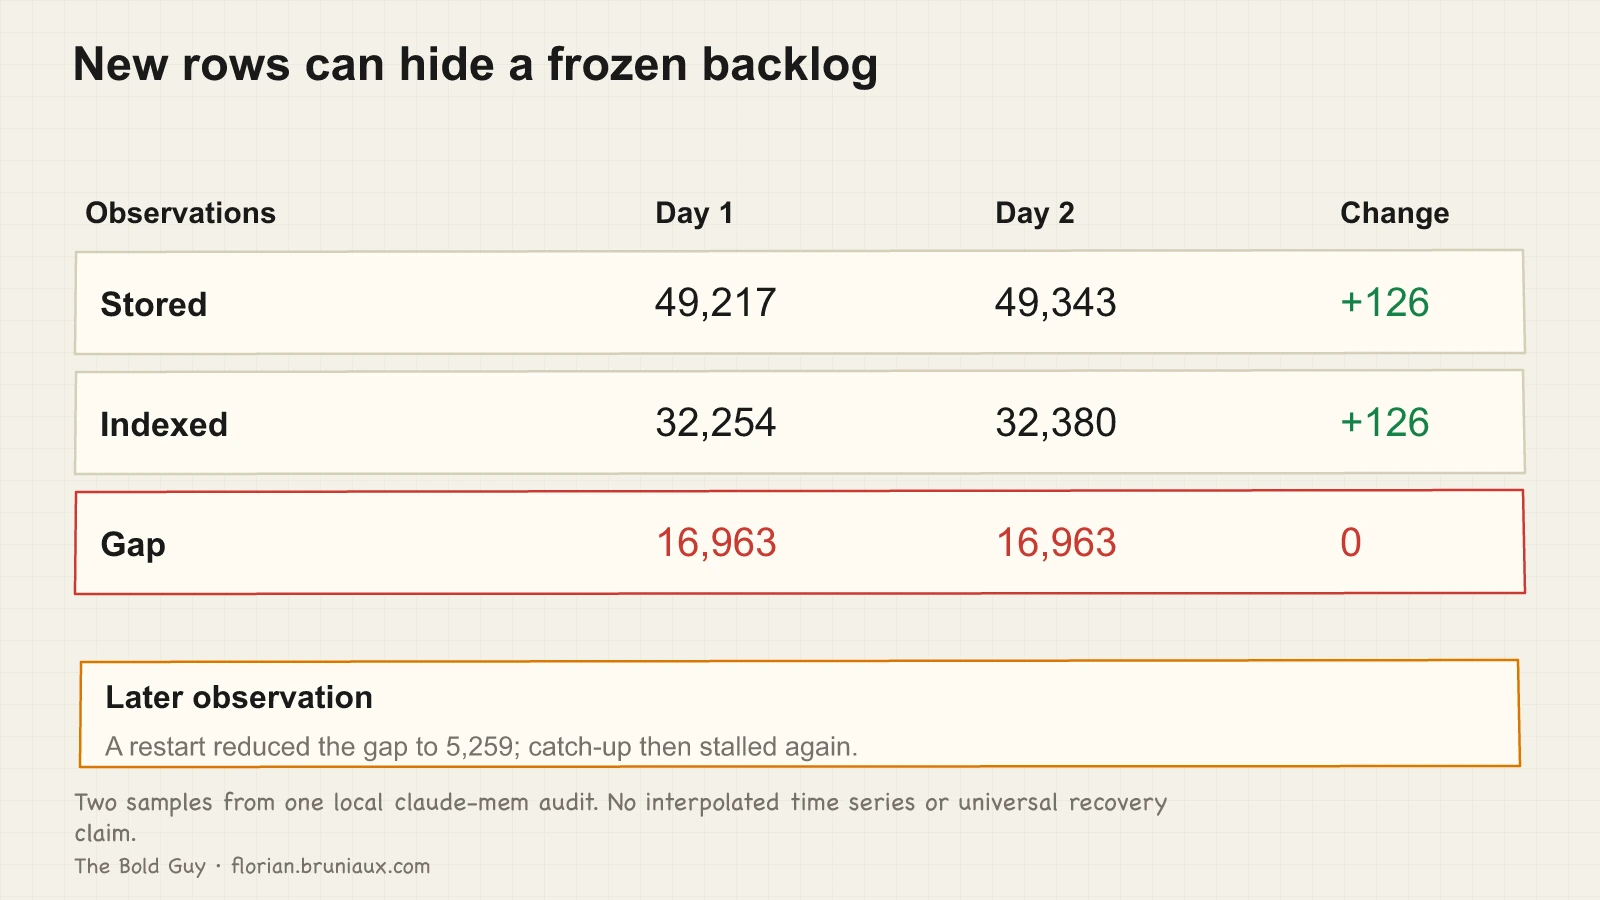
The incremental sync was perfect: 126 new observations created, 126 indexed, in real time. That’s what I had mistaken for a running backfill. The steady-state path indexed new rows while the backlog catch-up job had stopped.
The first cause: the catch-up only runs when the worker starts. It never re-arms during the process lifetime. My worker had been up continuously since the update, so it kept its backlog forever. Restarting it drained the backlog at roughly 215 observations per minute:
claude-mem restartThe 16 963 gap that had held for three days dropped to 15 655 within two minutes. Then it fell to 5 259 and stopped again, and a second restart moved it by nothing at all. The remaining 5 259 rows point to a second cause.
The second cause, which the first one hides: the catch-up is watermark-driven, and a watermark can advance past content that was never indexed.
Per project, chroma-sync-state.json holds the highest row id the sync believes it has handled. The sweep asks for rows above that mark. For one project the entry read observations: 52747, and the highest observation id that project has is 52747. Exact match. So the sweep had nothing to ask for, and the logs show what that looks like:
08:50:57.794 [CHROMA_SYNC] Starting smart backfill {project=app/feature-poc-meet}
08:50:57.795 [CHROMA_SYNC] Smart backfill complete {project=app/feature-poc-meet, synced=[object Object]}
One millisecond, reported as success. Meanwhile that project had 5 015 observations stored and 183 indexed.
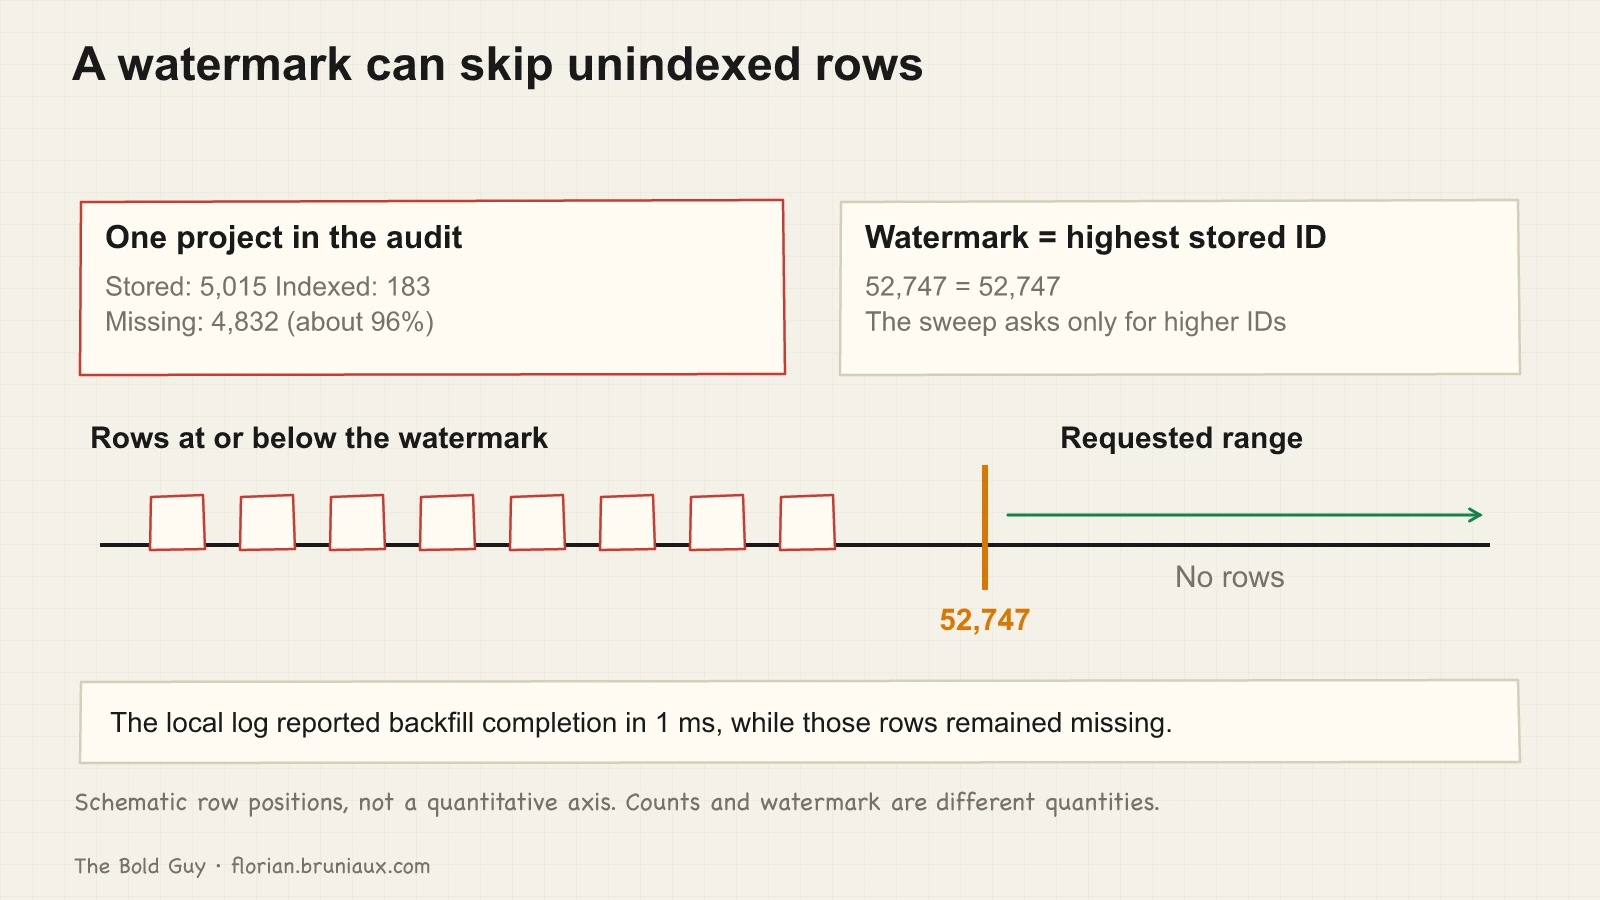
A per-project comparison found the whole residue in two places:
| Project | Stored | Indexed | Gap |
|---|---|---|---|
app/feature-poc-meet | 5 015 | 183 | 4 832 |
app | 27 626 | 27 482 | 144 |
claude-code-ultimate-guide | 105 | 55 | 50 |
The 144 on app is work in flight. The other two are burnt watermarks: 96 percent and 48 percent of those projects will never be indexed by any number of restarts, because the sweep has been told there is nothing to do.
The per-project check, which is the one worth running, since a global gap hides this completely:
python3 -c "
import json,pathlib,sqlite3
w=json.loads((pathlib.Path.home()/'.claude-mem/chroma-sync-state.json').read_text())
db=sqlite3.connect(pathlib.Path.home()/'.claude-mem/claude-mem.db')
for proj,maxid,n in db.execute('SELECT project,MAX(id),COUNT(*) FROM observations GROUP BY project'):
    mark=w.get(proj,{}).get('observations',0)
    if mark>=maxid and n>50: print(f'{proj:44} watermark burnt, {n} rows at risk')"
The source already contains the recovery bootstrap, but its guard prevents it from running. The bootstrap recomputes every watermark from what the vector store holds and records the ids below each mark that are missing, so the next sweep picks them up. It fires under one condition:
if (!ChromaSyncState.exists()) {
  logger.info('CHROMA_SYNC', 'Watermark cache missing — bootstrapping from Chroma (one-time)')
It runs only when the state file is absent. The current claude-mem build treats an existing file from an older build, carrying marks that were never verified, as proof that verification already happened. Mine gave itself away by having none of the pending keys the current code writes.
Deleting the cache follows the log’s own wording and recovers every project at once:
rm ~/.claude-mem/chroma-sync-state.json && claude-mem restartConfirm it fired before trusting it:
grep "bootstrapping from Chroma" ~/.claude-mem/logs/claude-mem-$(date +%F).logAny long-lived background worker with a startup-only reconciliation step holds whatever backlog it accumulates while looking busy. A reconciliation process that trusts a stored high-water mark inherits its errors because the mark disables the mechanism that would detect them. Track the stored-indexed gap over time. A file write confirms that the process is alive. The gap shows whether it is draining the backlog.
Under Claude Code’s macOS sandbox, ps, pgrep, and pkill fail with sysmond service not found, so process-level checks mislead you there. Use lsof -nP -iTCP:<port> -sTCP:LISTEN to see what’s listening, and claude-mem restart rather than signals.
6. Nothing is ever cleaned up
The check:
du -sh ~/.claude-mem && du -sh ~/.claude-mem/* | sort -rh | head -5What I found: 981 MB, of which roughly 550 MB was dead weight. Logs accounted for 397 MB across 116 files with no rotation, one day’s file weighing 66 MB. Two orphaned migration backups took another 269 MB, one from March and one from July, both superseded for weeks.
claude-mem has no retention setting. Logs accumulate until you delete them, and every schema migration leaves a full copy of the database behind.
find ~/.claude-mem/logs -name "*.log" -mtime +30 -delete
rm -f ~/.claude-mem/claude-mem.db.bak-* ~/.claude-mem/backups/claude-mem-pre-*.db
That took me from 981 MB to 431 MB.
Once indexing works, the vector index becomes the largest source of growth. Mine went from 125 MB to 1.3 GB in five days as the backfill drained, for 49 902 observations against a 245 MB source database. Plan for an index four to five times the size of the data it indexes. All of that growth came from index data.
The memory canary
Six checks is five too many to run by hand. This combines a subset into one command; retain the per-project, per-table and repeated-gap checks above. Adapt the paths if your layer differs; the four questions generalize to any of them.
#!/usr/bin/env bash
# memory-canary.sh (run weekly)
DB=~/.claude-mem/claude-mem.db
VEC=~/.claude-mem/chroma/chroma.sqlite3

echo "== scope =="
python3 -c "
import json,pathlib
d=json.loads((pathlib.Path.home()/'.claude/settings.json').read_text())
print('global:', d.get('enabledPlugins',{}).get('claude-mem@thedotmack','ABSENT'))"

echo "== coverage =="
S=$(sqlite3 "$DB" 'SELECT COUNT(*) FROM observations;')
I=$(sqlite3 "$VEC" "SELECT COUNT(*) FROM embedding_metadata WHERE key='field_type' AND string_value='narrative';")
echo "stored=$S indexed=$I gap=$((S-I))"

echo "== cost =="
sqlite3 "$DB" "SELECT generated_by_model, COUNT(*) FROM observations
  WHERE created_at > date('now','-7 days') GROUP BY 1;"

echo "== version =="
curl -s http://127.0.0.1:37777/api/health \
  | python3 -c "import json,sys; print('running', json.load(sys.stdin)['version'])"
npm view claude-mem version 2>/dev/null | sed 's/^/latest  /'

echo "== disk =="
du -sh ~/.claude-mem
To read the output, compare the same stored/indexed gap over time and by project; one large sample can also represent work in flight. Run claude-mem restart, then run the canary again and check that the gap moved. If it did not, run the per-project check from failure #5 because a global gap hides a burnt watermark. A cost line dominated by the expensive model when you configured tiering means the routing never fires. If the running version trails the latest release, update claude-mem before investigating anything else.
Run it regularly and compare successive results. This abbreviated canary does not establish coverage of all document types, projects or historical gaps on its own.
The write-access problem
Shared memory stores are durable write targets. A poisoned entry returns as trusted context in every future session until a user removes it. This guide covers single-user local stores. It has not surveyed the mitigations available in team-shared stores, so those deployments need a separate review of write permissions.
The six levels of context engineering guide addresses an earlier decision point: which context reaches Claude before persistent memory stores it.
Why I trusted claude-mem
I trusted claude-mem over four months. I’d ask it what we decided about a migration in May and get a usable answer, so I stopped questioning it. That trust was calibrated against claude-mem covering one repo out of forty, with an empty semantic index, on a June build.
Full-text search over 47 498 observations from my main repo returned useful answers, and every question I asked fell inside the part that worked. The missing answers stayed invisible because I had no reason to think claude-mem could have answered those questions.
The checks take two lines of SQL each. I skipped them for six weeks because claude-mem had never given me a reason to look.
Run the six checks before treating a clean claude-mem error log as evidence that the store works. I kept claude-mem after the audit, and I now run the canary weekly.
YSNK
(You should now know)
- A vector store running in local mode has no HTTP port, so a
curlhealth check against one fails identically on a healthy install and a broken one. Use claude-mem’s own deep probe, which runs a full search round-trip - A sync-state file that looks like a counter is usually a watermark. Summed across projects mine read 1 876 794 against 49 217 stored rows, which is meaningless. Per project it was the highest row id handled, which is the most useful number in the directory
- A watermark that advances past unindexed content survives every restart, because the sweep only asks for rows above the mark. One project logged
Starting smart backfillandSmart backfill completeone millisecond apart, reported as success, with 4 832 of its 5 015 rows unindexed - A one-time repair guarded on
if (!stateFile.exists())never runs on the installs that need it, since the corrupt state is itself a file. Deleting a cache is often the supported recovery path, and reading the guard tells you that faster than reading the docs - A startup-only reconciliation job in a long-lived worker holds its backlog indefinitely while the process looks busy. Measure the same gap 24 hours apart and per project. File writes do not show that reconciliation is draining the backlog
- Tiered cost routing that requires every message in a batch to be a read-only tool call will effectively never fire in an editing session. 13 040 observations on the expensive model against 342 on the cheap one, with tiering enabled the whole time
ps,pgrep, andpkillreturnsysmond service not foundunder Claude Code’s macOS sandbox. Uselsof -nP -iTCP:<port> -sTCP:LISTENfor what’s listening, andclaude-mem restartinstead of signals- Plan for the vector index at four to five times the size of the database it indexes. Mine reached 1.3 GB for a 245 MB source. The vector index accounted for that growth
Go Further in the Claude Code Guide
Practical resources selected to help you take the next step.
Open-source galaxy
Projects used in this path
Why this matters
The research and reasoning behind this playbook.
2/6 · Diagnose and repair context drift
Use L0 to L5 to diagnose context drift, then maintain adherence through observation, repair, and replay instead of treating setup as finished.
2/2 · Claude selected my output style. Then ignored it
Claude Code selected flow-lean but skipped its footer. A casing fix showed why installation, selection, and behavior need separate evidence.
1/6 · Opposite AI results: what context can explain
Anthropic measured merged PRs; METR measured task duration in a different setting. What these results and long-context research establish, and what remains a hypothesis.
Related guides
Claude Code setup, level by level
Three configuration layers for project context, daily tools and persistent memory, with checks for what loads and how it behaves.
Moving the memory observer to a local model: five constraints nobody documents
A September 2026 claude-mem 13.24.1 case study: moving observations from Sonnet 5 to Qwen2.5-Coder-7B, with measured timeout and output-quality limits.
Context engineering: the L0-to-L5 playbook
Choose context controls from L0 to L5 according to the failure you observe, from project documentation to scoped rules, behavior checks and shared configuration.