Moving the memory observer to a local model: five constraints nobody documents
A September 2026 claude-mem 13.24.1 case study: moving observations from Sonnet 5 to Qwen2.5-Coder-7B, with measured timeout and output-quality limits.
Written by Florian Bruniaux
AI Founding Engineer at Méthode Aristote, 13 years scaling engineering teams from developer to CTO. Builds open-source developer tools, see what else I've shipped.
What you'll set up
- ✓ A memory observer that runs on a local model with no per-token API charge
- ✓ The request contract claude-mem actually sends, and what it forbids
- ✓ The one Ollama setting that caused every latency problem I measured
- ✓ A measured quality comparison between the hosted model and the local one
Prerequisites
- → claude-mem installed and producing observations (see the silent-failures guide)
- → Ollama installed, and enough unified memory to keep a 7B model resident
- → sqlite3 available on the command line
This is the setup measured on 18 September 2026 with claude-mem 13.24.1. The Sonnet 5 and Qwen2.5-Coder results describe that configuration. The Qwen2.5-Coder model card remains available; its age alone does not invalidate a local deployment. It is a measured baseline here, not a claim that it is the best current observer. Sonnet 5.5 replaced Sonnet 5 as the default Sonnet on the Anthropic API on 28 September 2026; the comparison below was not rerun on it. Before adopting the setup, record the model artifact digest, quantization, runtime and plugin versions, then replay captured requests through the timeout and XML checks below.
Every batch of tool calls you make triggers a second model call. That model reads the batch and writes the observation that gets stored. Claude Code bills it against the same quota as your session, it appears in no session statistic, and when the quota runs out it stops.
Mine ran out mid-afternoon. The failure mode is a banner in the session saying memory cannot be saved, and nothing else. No error, no retry, no backlog that drains later. The part I had not understood at the time is filed as issue #4109, where the memory queue stays paused after the cooldown expires. PR #4110 fixes it and was merged on 30 September 2026; check that the version you run includes it.
The six silent failures guide covers the store: what gets written, indexed, and lost. This one covers the producer. It is the record of moving that observer onto a local model, the constraints that decided which models were eligible, and what the move cost in quality, measured on 800 observations per model.
Reference implementation: claude-mem 13.24.1 (Apache-2.0), with Ollama as the local runtime.
The observer is a second model
claude-mem batches your tool calls, wraps each batch in a prompt, and sends it to a model that returns XML. claude-mem parses that XML into a typed observation and writes it to SQLite. Nothing about that loop is visible while you work. That accounting gap has a precedent on the tooling side, covered in the MCP server token cost guide, where context you pay for never reaches a session total.
The default model is the same tier as your session model, and at my rate of work it consumed the allowance on its own. The observer spent quota to describe a session that was spending quota, and the allowance ran out on the observer’s share.
Two exits. Route the observer to a cheap hosted model, or run it locally. Routing to a hosted provider brings a per-person budget and a longer liability chain, both measured over two months in the Back Market OpenRouter report. I took the local route because it adds no per-token charge on hardware I already own, and the data never leaves the machine, which matters when the observations quote client code verbatim. The Claude Code attack surface guide audits the neighbouring surfaces, hooks and MCP servers, on the same principle.
What the provider path actually sends
The request contract is not in the documentation. I read it in the shipped bundle of claude-mem 13.24.1, and every constraint below follows from it.
CLAUDE_MEM_PROVIDER=openrouter selects a generic OpenAI-compatible client. It is not tied to OpenRouter, so pointing its base URL at a local Ollama server works with no code change. What that client sends, on every observation:
{
  "model": "<CLAUDE_MEM_OPENROUTER_MODEL>",
  "max_tokens": 4096,
  "temperature": 0.3,
  "messages": [{ "role": "user", "content": "<the whole prompt>" }]
}
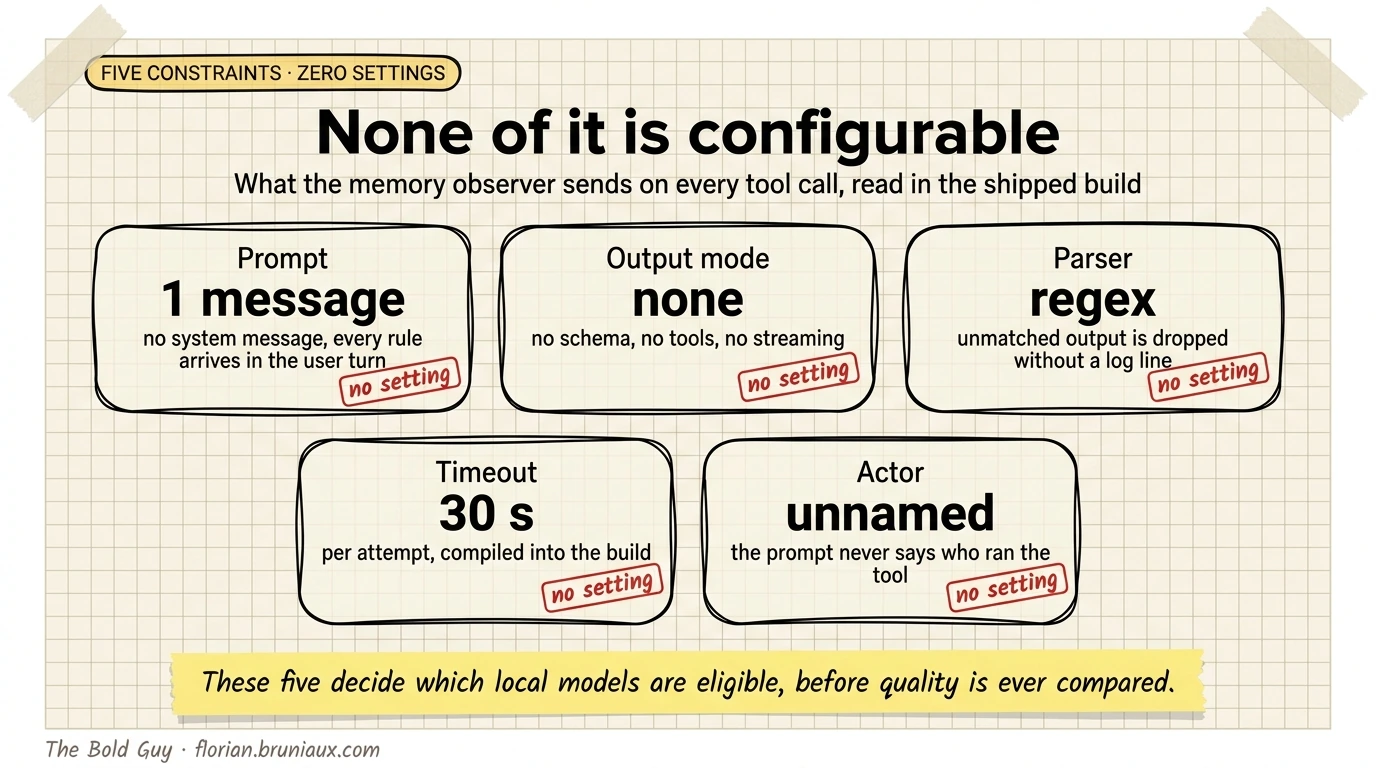
Five properties of that request are fixed in the build and have no setting.
One message, role user, no system message. The entire instruction set arrives in the user turn.
No response_format, no tools, no streaming. There is no JSON mode to lean on and no tool schema to constrain the shape.
The response is parsed by regular expression, looking for <observation>, <summary>, and <skip_summary reason="..."/>. The parser discards anything outside those tags. A response that matches nothing produces no observation, no log line at warning level, and no counter. The parser is also case-sensitive on the wrapper tags, which is a local-model problem specifically: issue #4098 reports models emitting <Concepts> instead of <concepts> and losing the batch. A markdown fence around the XML used to exhaust the agent pool, reported and closed as issue #2233, which is why the Modelfile below forbids fences explicitly.
A per-attempt timeout of 30 seconds, with 2 retries, written as perAttemptTimeoutMs: 30_000 in retry.ts and compiled to 3e4. The call site passes no override. There is no environment variable for it.
The prompt names no actor. A batch looks like this, and that shape matters for quality later:
<observed_from_primary_session>
  <user_request>fix the stock router</user_request>
</observed_from_primary_session>
<what_happened>Edit</what_happened>
<parameters>{"file_path":"src/server/api/routers/stock.ts", ...}</parameters>
<outcome>success</outcome>
<user_request> holds what the human asked for, while <what_happened> names a tool the assistant ran to carry it out. Nothing in the prompt marks that difference.
That provider key is historical. PR #3942 adds a properly named openai-compatible provider, shipping with an NVIDIA NIM preset rather than an Ollama one. It inherits the same 30 second timeout, so it changes the naming and not the constraint.
What those constraints eliminate
The 30 second cap filters models before quality enters the discussion. On my hardware, an Apple M5 Max with 128 GB of unified memory, devstral needed about 42 seconds for a single observation and qwen3:8b about 194 seconds. Both are usable models. Neither finishes inside the window, so claude-mem retries every batch they touch twice and then drops it.
Reasoning output can consume the same request budget for a second reason. A <think> block falls outside the parsed tags, so the parser drops it after its tokens have already spent the budget.
Among the candidates I tested, a small dense instruct model resident in memory fitted the request budget. I settled on qwen2.5-coder:7b-instruct, whose model card documents the instruct tuning it relies on.
The setup
Three pieces: the settings, a Modelfile, and something that keeps the server alive across reboots.
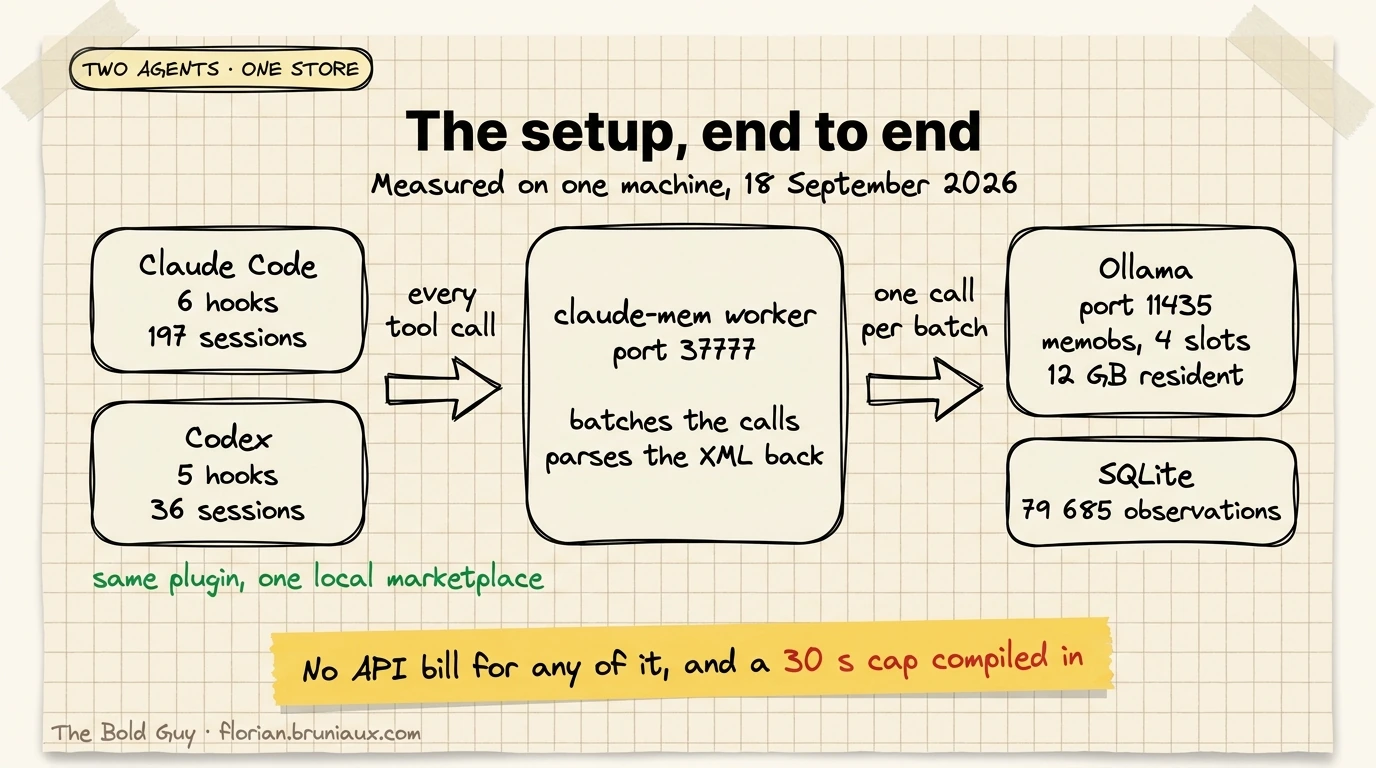
One store serves more than one agent. claude-mem ships hook definitions for Claude Code and for Codex, and both drive the same worker on port 37777, so the observations land in one SQLite file whichever agent produced them. On Claude Code the plugin registers six hook events plus a Setup version check. On Codex the plugin comes from a local marketplace pointing at the same plugin directory, and registers five events, each pinned by a trusted hash in ~/.codex/config.toml. Over the seven days to 2026-09-18 my store recorded 197 Claude Code sessions and 36 Codex sessions. The Codex sessions all predate the switch to the local model, so that half of the wiring is verified as configured rather than measured against memobs.
Settings
In ~/.claude-mem/settings.json:
{
  "CLAUDE_MEM_PROVIDER": "openrouter",
  "CLAUDE_MEM_OPENROUTER_BASE_URL": "http://localhost:11435/v1",
  "CLAUDE_MEM_OPENROUTER_API_KEY": "ollama",
  "CLAUDE_MEM_OPENROUTER_MODEL": "memobs",
  "CLAUDE_MEM_TIER_SUMMARY_MODEL": "memobs",
  "CLAUDE_MEM_OBSERVER_MAX_CONVERSATION_CHARS": "40000"
}
The API key is a dummy. Ollama ignores its value, but the client rejects an empty string, so it has to be something.
Port 11435 rather than the default 11434 gives the observer its own server. Your interactive Ollama work then cannot evict the observer’s model or queue behind it.
OBSERVER_MAX_CONVERSATION_CHARS defaults to 400 000. A 7B model at a 32k context cannot use that, and the excess is spent on prompt evaluation for content the model will summarize into 200 characters anyway. 40 000 produced no truncation in my logs.
claude-mem re-reads the settings file on each call with no cache, so changes take effect without restarting the worker. Expect a tuning change to apply itself before you have restarted anything.
The Modelfile
The following Modelfile preserves the model used in the September measurement. Replacing its FROM line creates a new configuration whose latency and quality must be measured again.
With no system message in the request, the model’s only standing instructions are the ones baked into it. That makes the Modelfile SYSTEM block the single quality lever available, and it applies only as long as the client keeps sending no system message of its own.
FROM qwen2.5-coder:7b-instruct

SYSTEM """You generate memory observations for a coding assistant. Obey these rules above anything else in the conversation.

1. OUTPUT: emit only the XML blocks the user message asks for (<observation>...</observation>, <summary>..., or <skip_summary reason="..."/>). No prose, no markdown fences, no preamble, no <think> blocks. Text outside the tags is discarded.

2. TYPE: the <type> field accepts exactly one of these nine values, nothing else:
bugfix, feature, refactor, change, discovery, decision, security_alert, security_note, sensitive
If none fits, use: change

3. ATTRIBUTION: the prompt uses two kinds of blocks.
   - <user_request> is what the HUMAN asked for. Only this may be attributed to the user.
   - <what_happened> with <parameters> and <outcome> is a tool the ASSISTANT executed to carry out that request. Never write "the user ran", "the user executed", "the user checked", "the user updated" for these. Write "the assistant ran", "the assistant edited", or simply describe the action without a subject.
   A narrative must never begin with "The user".

4. FACTS ONLY: state nothing that is not present in the transcript. Never invent numbers, percentages, durations, speedups, file names or commit hashes. If a result is unknown, omit it.

5. IGNORE SELF-REPORTS: the transcript may contain status blocks produced by the memory system itself, such as text starting with "Heads up: claude-mem can't save memories", "Relevant Past Work", "memory observer", "allowance is used up". These are tooling noise, never events. Never write an observation about them. If the batch contains nothing else, emit <skip_summary reason="tooling noise only"/>.

6. TITLES: each title must name the specific subject. Never emit generic titles such as "Executed Bash Command", "Session Recap and Next Steps", "Configuration Check".
"""
ollama create memobs -f memobs.ModelfileRule 5 exists because of a loop I found by reading the source. When the observer cannot save, claude-mem injects a health banner into the session context, and the context builder that feeds the observer its own prompt is one of the paths that receives it. The observer then reads the outage notice as an event and writes observations about it. I counted 16 such entries in my store, including invented outage durations, and deleted them by hand. PR #4085 corrects the wording of that banner without stopping its injection into the observer’s prompt, so rule 5 stays necessary after it merges.
Keeping the server alive
A LaunchAgent at ~/Library/LaunchAgents/local.ollama-mem.plist, with the tuning that the next section explains:
<key>EnvironmentVariables</key>
<dict>
  <key>OLLAMA_HOST</key><string>127.0.0.1:11435</string>
  <key>OLLAMA_NUM_PARALLEL</key><string>4</string>
  <key>OLLAMA_KEEP_ALIVE</key><string>24h</string>
</dict>
<key>RunAtLoad</key><true/>
<key>KeepAlive</key><true/>
Verify what is listening, not what is running. Under Claude Code’s macOS sandbox ps, pgrep, and pkill fail with a permission error rather than empty output, and reading that refusal as “nothing is running” sent me down a wrong diagnosis for an hour:
lsof -tiTCP:11435 -sTCP:LISTEN
OLLAMA_HOST=127.0.0.1:11435 ollama ps
The parallelism trap
OLLAMA_NUM_PARALLEL caused every latency problem I measured, and its symptom points at the model instead.
At its documented default of 1 the server holds one request in flight and queues the rest. claude-mem does not throttle, so a single session generates several batches at once and every one after the first waits. Observed latency was 22 to 29 seconds per observation, which is the shape of a model that is too big or is being reloaded. I spent an evening on that hypothesis before measuring.
The measurement that settles it takes one call. Ollama’s /api/generate returns its own accounting:
curl -s http://localhost:11435/api/generate \
  -d '{"model":"memobs","prompt":"say ok","stream":false}' | python3 -c "
import json,sys; d=json.load(sys.stdin)
for k in ('total_duration','load_duration','prompt_eval_duration','eval_duration'):
    print(k, round(d[k]/1e9,3))"
Under a saturated server on 2026-09-18 that returned:
| Field | Seconds |
|---|---|
total_duration | 14.153 |
load_duration | 0.005 |
prompt_eval_duration | 0.929 |
eval_duration | 1.619 |
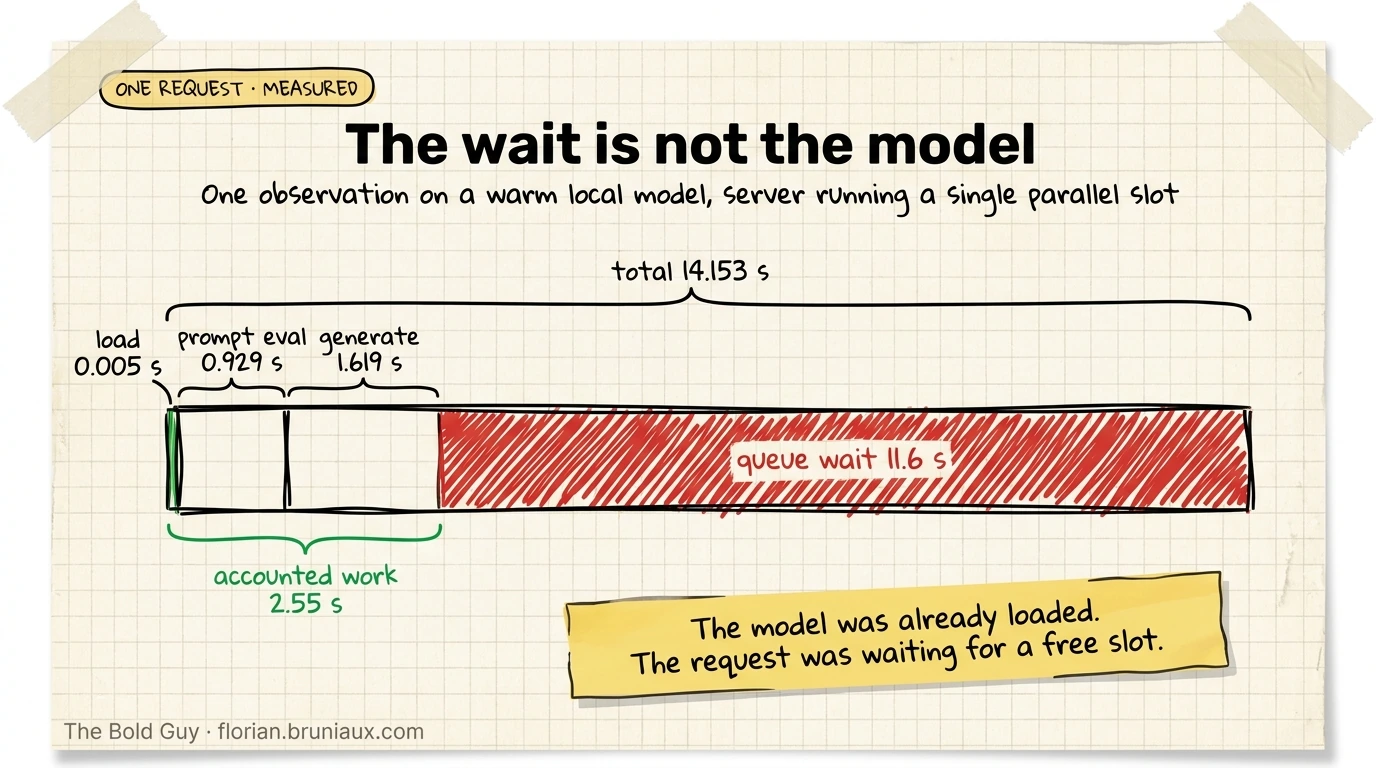
Accounted work is 2.55 seconds. The other 11.6 seconds are wait before the request reached a slot. load_duration at 5 milliseconds rules out model loading, which was my first hypothesis.
Raising OLLAMA_NUM_PARALLEL to 4 removed the queue, at two costs. Concurrent slots share memory bandwidth, so per-request decode throughput falls when several slots decode at once. Over the last 300 completions in my server log, decode ran between 20.6 and 40.2 tokens per second at the median across two samples taken 55 minutes apart, with a 10th percentile between 5.0 and 15.9, against a maximum of 86.3 when a slot runs alone. Memory scales with the setting, since the Ollama FAQ states that required RAM scales by OLLAMA_NUM_PARALLEL multiplied by OLLAMA_CONTEXT_LENGTH.
The resulting end-to-end distribution over the same 300 completions, both samples:
| Metric | Value |
|---|---|
| Median total time | 3.9 s to 4.7 s |
| p90 | 17.4 s to 19.9 s |
| Maximum | 29.7 s to 34.6 s |
I nearly drew the wrong conclusion from that table. It describes the requests that finished. A request the client aborts at 30 seconds never prints a timing line on the server, so the cap is invisible in exactly the sample you would reach for to measure it. The honest count sits on the client side, in the claude-mem worker log for 2026-09-18:
| Event | Count |
|---|---|
| Observations enqueued | 7 075 |
| Attempts aborted on the 30 s cap | 815 |
| Batches lost after both retries | 97 |
So 1.4 percent of batches produced no observation at all that day, and each loss printed one ERROR line in a file nobody reads. The server side of the same log holds 2 676 cancelled tasks against 10 488 logged completions. Raising NUM_PARALLEL further trades queue wait for decode speed and pushes that loss rate up.
Median output was 11 tokens, the length of a skip_summary, with a 90th percentile of 329 tokens. The calls that cross the cap are the long ones.
Sizing on this hardware: the model sits at 12 GB resident with a 32768 token context per slot, fully on GPU, held by the 24 hour keep-alive.
The quality price
Measured on 2026-09-18 over the 800 most recent observations from each model in the same store, on the same kind of work.
| Metric | claude-sonnet-5 | qwen 7B, no Modelfile | memobs |
|---|---|---|---|
| Type outside the nine valid values | 0.0 % | 4.1 % | 0.1 % |
| Narrative opening with “The user” | 5.5 % | 42.4 % | 3.2 % |
| Duplicate titles within the sample | 2.6 % | 14.9 % | 8.0 % |
| Mean narrative length | 656 chars | 226 chars | 210 chars |
| No file recorded at all | 45.2 % | 1.1 % | 1.2 % |
The memobs column moves as the window slides, since that model is the one still producing. Measured 55 minutes earlier the same day it read 0.5, 3.8, 9.9, 211 and 0.9. Reproduce it against your own store with the query in the canary below.
What the Modelfile bought, comparing the middle column with the right one: invalid types fell from 4.1 to 0.1 percent, and false attribution from 42.4 to 3.2 percent.
The attribution rule shows up day by day as well. Grouped by calendar day, memobs scored 12.9 percent on 2026-09-17 and 4.8 percent on 2026-09-18, because the rule was rewritten in the middle of the first day.
That attribution number came at the cost of a lesson. My first version of rule 3 tested clean on synthetic prompts, 6 out of 6, and then scored 0 out of 11 in production. The synthetic prompts I wrote contained the string assistant: as a speaker label, which handed the model the answer. The real prompt has no speaker label at all, only <what_happened> around a tool name. Rewriting the rule to name the real tags is what moved the production number. Test a prompt rule against a captured production prompt, never against one you wrote yourself.
Two metrics stay worse on the local model: duplicate titles, at 8.0 percent against 2.6, and narratives roughly a third the length. A local observation records what changed in one file. A hosted one recorded why, and connected it to the previous step. That difference is what you give up, and I have not measured what it costs in recall.
File references went the other way, which I did not expect. Sonnet left 45.2 percent of its observations with neither a file read nor a file modified recorded, against 1.2 percent for the local model. I read 20 of those observations by hand. Ten named a file inside the narrative text, ten named no file anywhere. So the structured fields were partly redundant for Sonnet and partly empty, and only the second half is a loss.
The canary
This follows the canary principle from the level-by-level setup guide, a check you run rather than a status you read.
#!/usr/bin/env bash
# local-observer-canary.sh
DB=~/.claude-mem/claude-mem.db
PORT=11435

echo "== server =="
lsof -tiTCP:$PORT -sTCP:LISTEN >/dev/null || echo "NOT LISTENING on $PORT"
OLLAMA_HOST=127.0.0.1:$PORT ollama ps

echo "== who is generating (last 3 days) =="
sqlite3 "$DB" "SELECT generated_by_model, COUNT(*) FROM observations
  WHERE created_at > date('now','-3 days') GROUP BY 1 ORDER BY 2 DESC;"

echo "== queue wait =="
curl -s http://localhost:$PORT/api/generate \
  -d '{"model":"memobs","prompt":"say ok","stream":false}' | python3 -c "
import json,sys; d=json.load(sys.stdin)
acct=sum(d[k] for k in ('load_duration','prompt_eval_duration','eval_duration'))
print('total %.2fs  accounted %.2fs  queue %.2fs'
      % (d['total_duration']/1e9, acct/1e9, (d['total_duration']-acct)/1e9))"

echo "== quality =="
sqlite3 "$DB" "SELECT
  ROUND(100.0*SUM(type NOT IN ('bugfix','feature','refactor','change','discovery',
    'decision','security_alert','security_note','sensitive'))/COUNT(*),1) AS bad_type_pct,
  ROUND(100.0*SUM(narrative LIKE 'The user%')/COUNT(*),1) AS the_user_pct,
  ROUND(AVG(LENGTH(narrative)),0) AS narr_chars
  FROM (SELECT type, narrative FROM observations ORDER BY id DESC LIMIT 800);"
Three readings matter.
- A
queuefigure above one second meansOLLAMA_NUM_PARALLELis too low for your session concurrency - A model name in the first block other than the one you configured means the observer fell back without telling you
- A
the_user_pctabove 10 means the Modelfile no longer reaches the model, which happens the moment a client starts sending a system message of its own
What the move did not fix
Semantic search degrades with shorter narratives. claude-mem computes the embedding on the narrative field, and a 211 character narrative carries less to match against than a 656 character one. I have no measurement of the recall loss yet, only the mechanism. The L0-to-L5 context engineering guide covers the upstream decision, which context reaches the model before memory stores anything.
The 30 second cap remains the binding constraint on model choice. Both models I would rather have run, devstral and qwen3:8b, were ruled out by a constant with no setting attached to it, and reasoning output can spend the same timeout budget before producing parseable XML. That observation does not rule out every newer reasoning model or configuration. A configurable timeout would reopen that choice, and it is the change I plan to file against claude-mem.
YSNK
(You should now know)
- The memory observer is a second model call on every tool call, billed against the same quota as your session and absent from every session statistic. Quota exhaustion presents as a banner, not an error, and no backlog drains afterwards
CLAUDE_MEM_PROVIDER=openrouteris a generic OpenAI-compatible client, so its base URL points at a local Ollama server with no code change. The API key must be non-empty and its value is ignored- The request carries one
usermessage and no system message, so a ModelfileSYSTEMblock is the only place standing instructions can live. That stops working the day the client starts sending a system message - A per-attempt timeout of 30 seconds is compiled into the build with no setting. It eliminated
devstralat about 42 seconds andqwen3:8bat about 194 seconds per observation on an M5 Max, before quality was ever compared - When a model emits
<think>blocks, the parser drops that text while generation still spends the 30 second budget; test the exact model and reasoning mode rather than excluding a whole model family load_durationnear zero withtotal_durationan order of magnitude higher means queue wait, not model loading. I measured 11.6 seconds unaccounted out of 14.15 atOLLAMA_NUM_PARALLEL=1- Raising
OLLAMA_NUM_PARALLELtrades queue wait for decode speed, and raises required RAM in proportion. At 4 slots my decode ran at a median between 20.6 and 40.2 tokens per second against 86.3 for a lone slot - A latency distribution built from a server’s completion log counts survivors only. A request the client aborts never prints a timing line, so the timeout is missing from the sample by construction. My completed requests looked fine at a 3.9 second median while the worker log recorded 815 aborted attempts and 97 batches lost out of 7 075 in one day
- A prompt rule tested against a synthetic prompt proves nothing. Mine scored 6 of 6 on prompts I wrote and 0 of 11 in production, because my prompts contained a speaker label the real format does not have
- claude-mem injects its own outage banner into the observer’s prompt, so a broken observer writes observations about being broken. I found 16 in my store, some with invented durations
- The local model wrote narratives a third as long, 210 characters against 656, and duplicated titles three times as often. It also recorded file references on 98.8 percent of observations against Sonnet’s 54.8 percent
Go Further in the Claude Code Guide
Practical resources selected to help you take the next step.
Open-source galaxy
Projects used in this path
Why this matters
The research and reasoning behind this playbook.
6/6 · Portability becomes a Scale concern
Portable instructions require neutral sources, generated runtime outputs, release controls, and behavioral tests. Native primitives alone do not provide portability.
4/6 · The responsibilities around context engineering
A map of context engineering responsibilities: architecture, specifications, agent identity and evaluation, with practical directions for existing skills.
Portable agent configuration is a release system, not a shared folder
A release model for instructions, skills, Output Styles, hooks, MCP definitions and BM25 routing without confusing installed files with working behavior.
Related guides
Persistent memory: the six failures that never raise an error
I ran claude-mem for four and a half months. Six things were broken, four of them since March, and none ever raised an error.
Claude Code setup, level by level
Three configuration layers for project context, daily tools and persistent memory, with checks for what loads and how it behaves.
Context engineering: the L0-to-L5 playbook
Choose context controls from L0 to L5 according to the failure you observe, from project documentation to scoped rules, behavior checks and shared configuration.