How to read a token-compression benchmark
Read token-compression claims through their denominators, paired tasks, cache costs and success criteria, with Tokenade versus RTK as a worked example.
Jump to summary
Written by Florian Bruniaux
AI Founding Engineer at Méthode Aristote, 13 years scaling engineering teams from developer to CTO. Builds open-source developer tools, see what else I've shipped.
A token optimizer can make each response smaller and the completed task more expensive. The agent may need additional calls, lose a cache hit or retry after a detail disappears. A useful benchmark follows those consequences through to the accepted result.
Disclosure: I contribute to RTK. This article applies the same measurement standard to RTK and competing tools. The vendor results below have not been independently reproduced here.
TL;DR
| Question | Evidence to request |
|---|---|
| What was measured? | Payload size, full-session usage or cost per accepted task |
| Same tasks? | Matching inputs, pinned versions and repeated runs |
| How uncertain? | Per-task distribution, confidence intervals and sample unit |
| Which tokens? | Fresh input, cache writes, cache reads and output |
| What passed? | Verifiers, thresholds, scores and failures |
| What changed? | Every enabled hook, prompt, model and external service |
Pair it, or the sample decides
Run both configurations against the same tasks. Otherwise a set of easy fixes can look cheaper than a set of difficult migrations for reasons unrelated to compression. Pairing controls task composition; it does not remove the model’s sampling variance or an execution-order effect. Repeated runs and an explicit cache policy address different sources of noise.
Record the model identifier, agent version, optimizer version and binary hash where possible. If a rebuilt binary keeps its version string, that string alone cannot reproduce the treatment. THOL’s Tokenade manifest explicitly records such a rebuild. Tokenade benchmark configuration
The n=6 trap
For an exact two-sided sign test with six independent, non-tied pairs, six effects in the same direction give p = 2/64 = 0.03125. Both six wins and six losses reach that value. Five wins and one loss give p = 0.21875. The test discards effect magnitude; it does not establish how much money was saved.
| Non-tied pairs | Smallest two-sided p-value | Condition |
|---|---|---|
| 6 | 0.03125 | All effects have the same sign |
| 8 | 0.0078125 | All effects have the same sign |
| 10 | 0.001953125 | All effects have the same sign |
A significant result on six tasks is evidence, with limited coverage and coarse resolution. It is not meaningless. Replicates improve estimates within each task, but do not become additional independent tasks. Ties change the effective sample size. Report effect sizes and intervals alongside the test, then test additional task families before generalizing.
Which number are they citing
The median per-task saving, the arithmetic mean of savings, the geometric mean of cost ratios and the ratio of total costs answer different questions. A pooled cost ratio weights expensive tasks more heavily. A per-task geometric mean gives each included task a contribution on the logarithmic scale.
A difference between mean and median does not prove one outlier caused it. Inspect the distribution. Do not turn results from separately tested mechanisms into a combined claim without running their combination: both mechanisms may remove the same content or alter later calls.
Which token class did they cut
Use the rates for the tested model and billing route. Fresh input, cache writes, cache reads and generated output can have different prices. An equal reduction in two token classes can therefore produce different monetary savings. Rewriting a cached prefix may also create a new write cost.
Characters divided by four is a heuristic, not an OpenAI tokenizer. Its error varies with code, prose and language; it is not always optimistic. An offline compression ratio should name its tokenizer or estimation method. For session costs, retain provider usage and distinguish local price calculations from the authoritative bill. Claude Code usage and cost documentation
The metric they left out
Compare costs at an acceptable outcome. In a hypothetical experiment, reducing cost per attempt by 20% while reducing the success probability by 25% raises expected cost per success by about 6.7%, under a repeated-attempt model: 0.80 / 0.75 = 1.067. This is arithmetic illustrating a failure mode, not a measured result for any vendor.
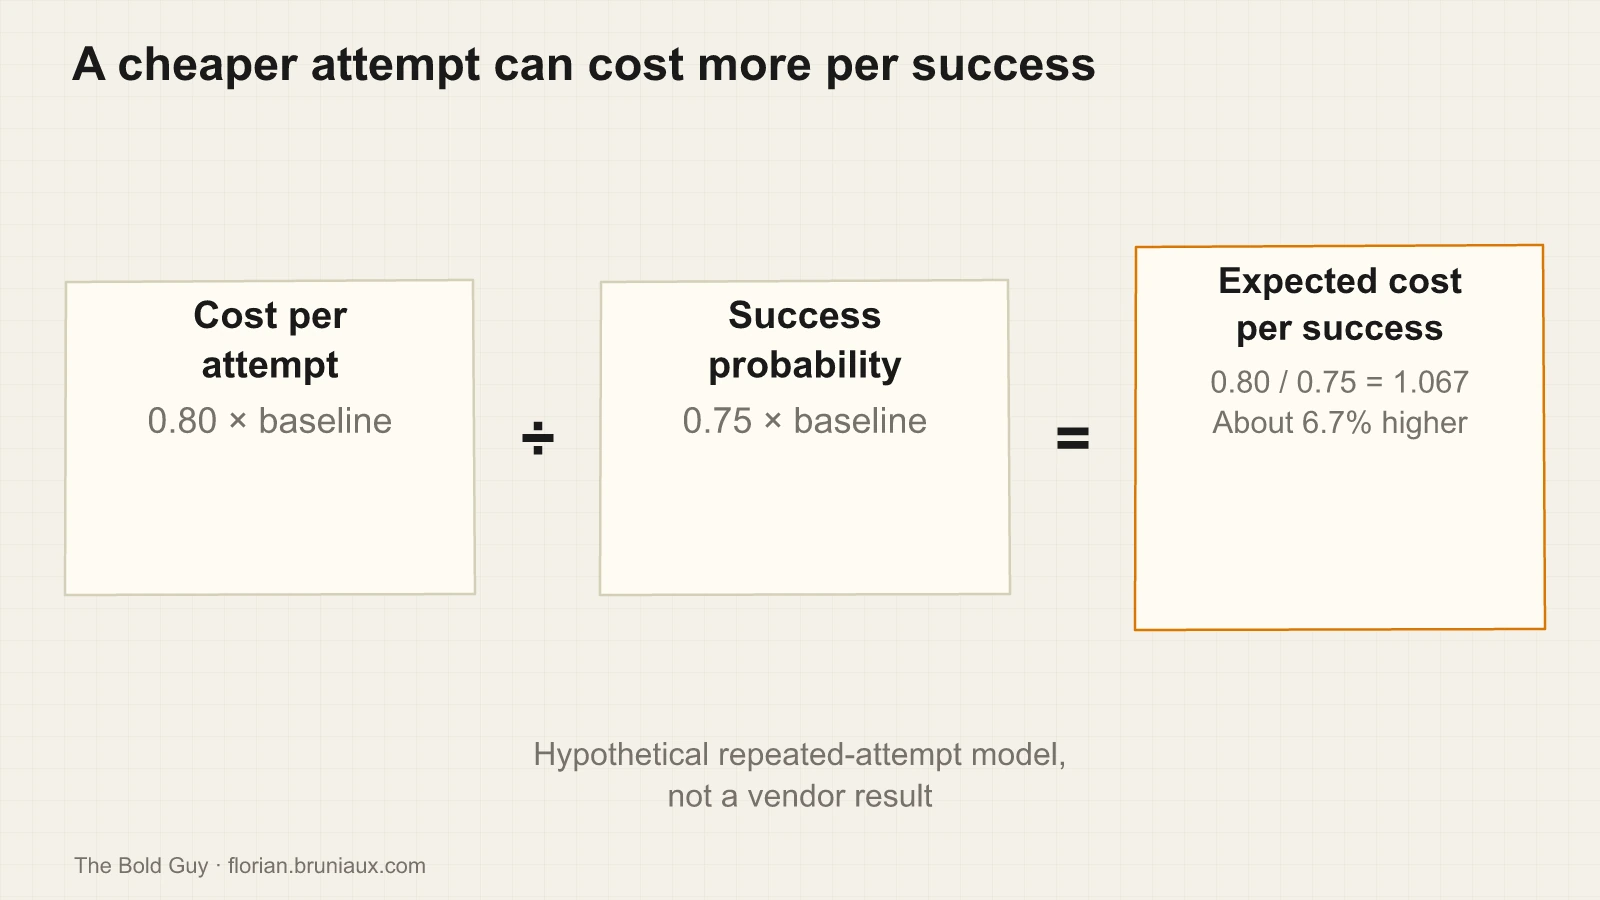
Report both cost conditional on success and all-attempt spend per success. They differ when failures consume resources. A binary pass also depends on the verifier’s threshold: retain continuous scores where they exist and inspect what the test misses.
Tokenade versus RTK: reading a vendor-maintained leaderboard
THOL publishes its harness, manifests, fixtures, verifiers and result data. Its maintainer also develops Tokenade and discloses that conflict. Public methodology makes a result inspectable; independent reproduction is a separate property. THOL methodology
The historical campaign below used Claude Code 2.1.206 and Sonnet 4.6. Its results remain tied to those versions, the named optimizer releases and the campaign’s price assumptions. They have not been rerun on current Claude Code defaults. The campaign reports the following geometric means of per-task cost ratios:
| Configuration | Cost ratio vs control | Published 95% interval | Successful runs |
|---|---|---|---|
| Tokenade 0.8.13 | 0.768 | 0.647–0.900 | 170/170 |
| RTK 0.42.3 | 1.052 | 0.913–1.190 | 170/170 |
Both cover 17 tasks. Tokenade’s estimated reduction is 23.2%; RTK’s interval spans both savings and a penalty. That is inconclusive for a difference from control, not proof of equivalence. Tokenade’s seven-task long-session subset reports a 38.9% reduction; keep that denominator separate from the full campaign. Independent measurements of RTK point the same way on total cost: Dasein reports +13% (54 tasks resolved against 57 without it), and JetBrains reports +7.6% median cost per task at low effort (p=0.004) and +0.1% at high effort (p=0.99). The guide’s independent benchmark table lists each setup and its conflicts of interest. Published campaign data
The protocol aggregates successful runs. For these two arms, all published runs pass, so a difference in failure rates does not explain their ranking. That still leaves the verifier thresholds and task coverage to examine. A broad claim about quality requires more than the pass counts.
The treatment is also broader than its name suggests. Tokenade installs output-style instructions, encourages batching and configures several hooks and context settings. RTK’s arm installs its command wrapper and Bash hook. An advantage for the complete Tokenade configuration does not identify which mechanism caused it. Test components separately before crediting semantic search, compression or cache management with the whole result.
Reproducibility has a distribution boundary too. Tokenade’s installer is public, but its current licence describes a proprietary engine. The benchmark configuration and the optimizer’s implementation are different artifacts. Distribution licence
The lab number and the invoice
A benchmark is neither an upper nor a lower bound on production savings. Your work may contain more verbose logs, longer sessions or stricter acceptance criteria. Indexing and licence costs may be amortized differently. A subscription user’s reduced token use may free capacity without lowering the fixed fee.
The comparison worth repeating locally uses your task mix and includes setup, failed attempts, worker models and review effort. Keep task-level results rather than selecting only the most favourable category. A benchmark’s own uncertainty interval does not cover the uncertainty of transferring its result to your workload.
The list I run before I believe a number
Record the denominator, paired tasks, versions, repeated runs, token classes, cache policy, verifier and all-attempt cost. Check whether the sponsor sells the winner and whether the tested binary can be identified. Separate measured configuration effects from explanations that still need a component-level experiment.
For the mechanisms behind these comparisons, see the token-reduction toolbox. Cost accounting extends into review and rework in the guide’s unit-economics reference. The token-savings page compares vendor claims with six public benchmarks and lists each publisher’s interest.
YSNK
(You should now know)
- Pairing controls task composition, not every source of variance
- A small sign-test p-value does not measure effect size; six-task evidence has limited coverage
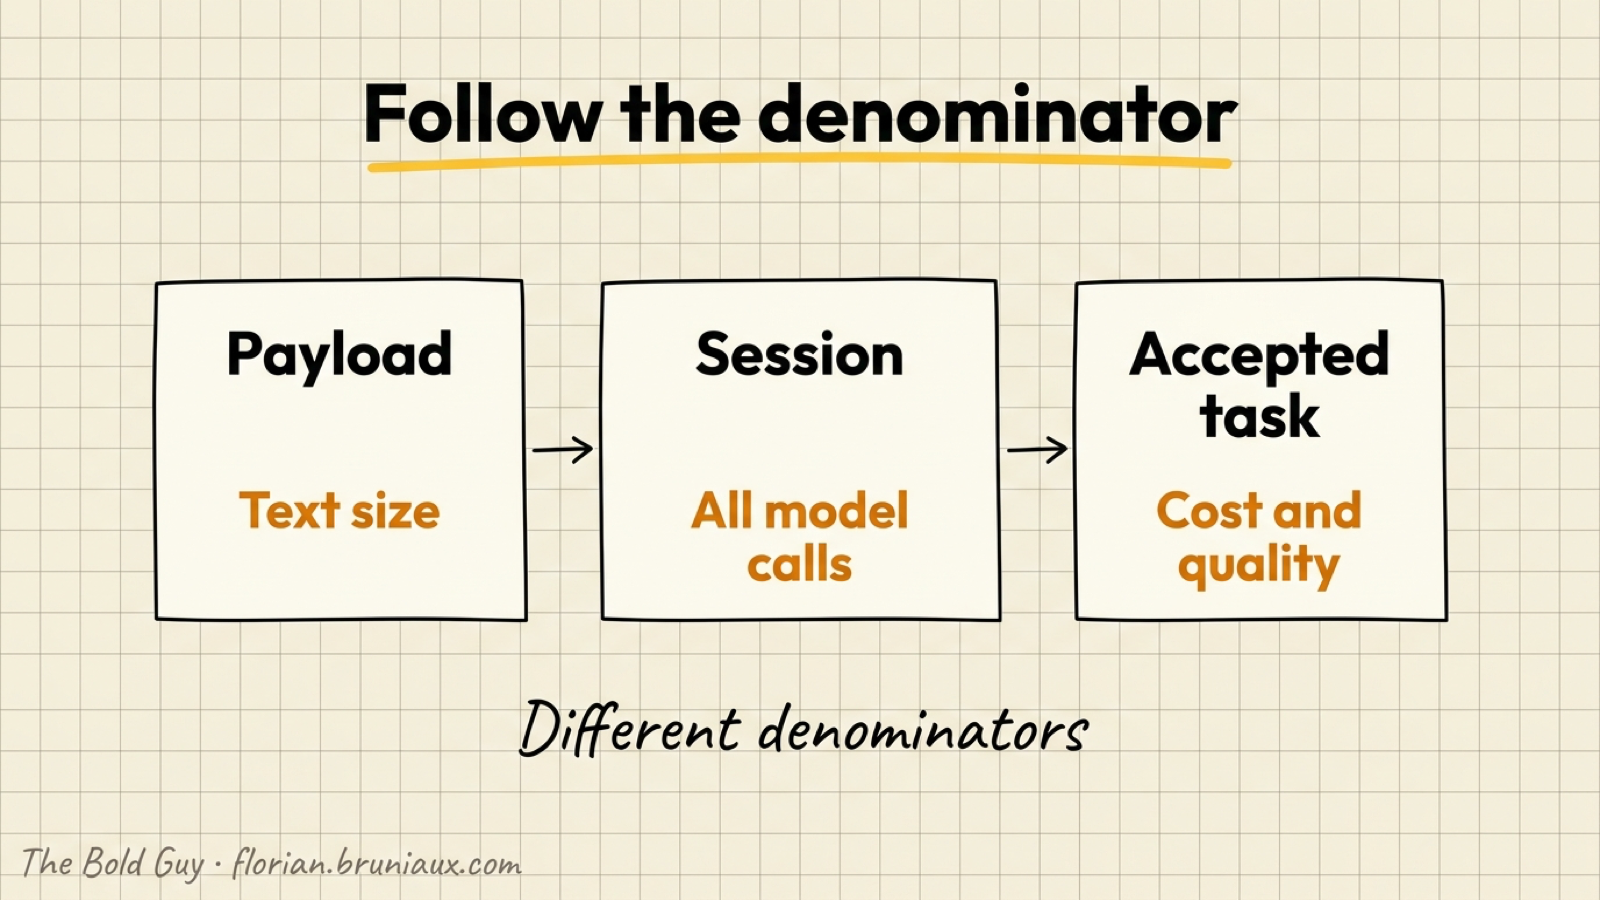
- A token estimate, a session cost and cost per accepted task have different denominators
- THOL favours Tokenade in its published campaign, with a disclosed vendor relationship and no independent reproduction here
- Comparing complete configurations cannot establish the causal contribution of each component
Go Further in the Claude Code Guide
Practical resources selected to help you take the next step.
Open-source galaxy
Projects used in this path
Related articles
Go deeper
Step-by-step guides that put this into practice.