3/6 · Four Layers, Not a Ranking: Mapping the Token-Reduction Toolbox
Token reduction is four layers, not competing tools. The map, three deep dives, and the cost blind spot that hides spending from Claude Max and Pro users.
Context Engineering, a six-part series. You’re reading part 3: the tooling. Part 1: the science · Part 2: the discipline · Part 3: the tooling (you are here) · Part 4: the roles · Part 5: the team · Part 6: the portability
| The frame | Token reduction is FinOps for AI. Measure first, optimize second |
| The map | Four layers, each filtering a different point in the token flow |
| The leverage | Layer 1 (CLI output) is the cheapest win: a small share of total volume, but pure noise and trivial to filter |
| The MCP tax | One GitHub MCP server can cost 44K tokens for a one-line question |
| The blind spot | API gateways see nothing on Max/Pro. No API key, nothing to intercept |
Disclosure up front: I’m a core contributor to RTK, one of the tools mapped below. I’ve kept the numbers sourced and the comparisons honest, but you should know where I sit.
In 2014, cloud teams were burning money they couldn’t see. EC2 instances running overnight for nothing, forgotten S3 buckets, credits vanishing into a bill nobody could break down. Then FinOps showed up. Not a tool, a discipline: measure first, optimize second, attribute everything. In 2026 the same thing is happening with tokens. The Claude Max license itself is fine, predictable, a fixed cost. What actually hurts is the noise you inject into every session without seeing it.
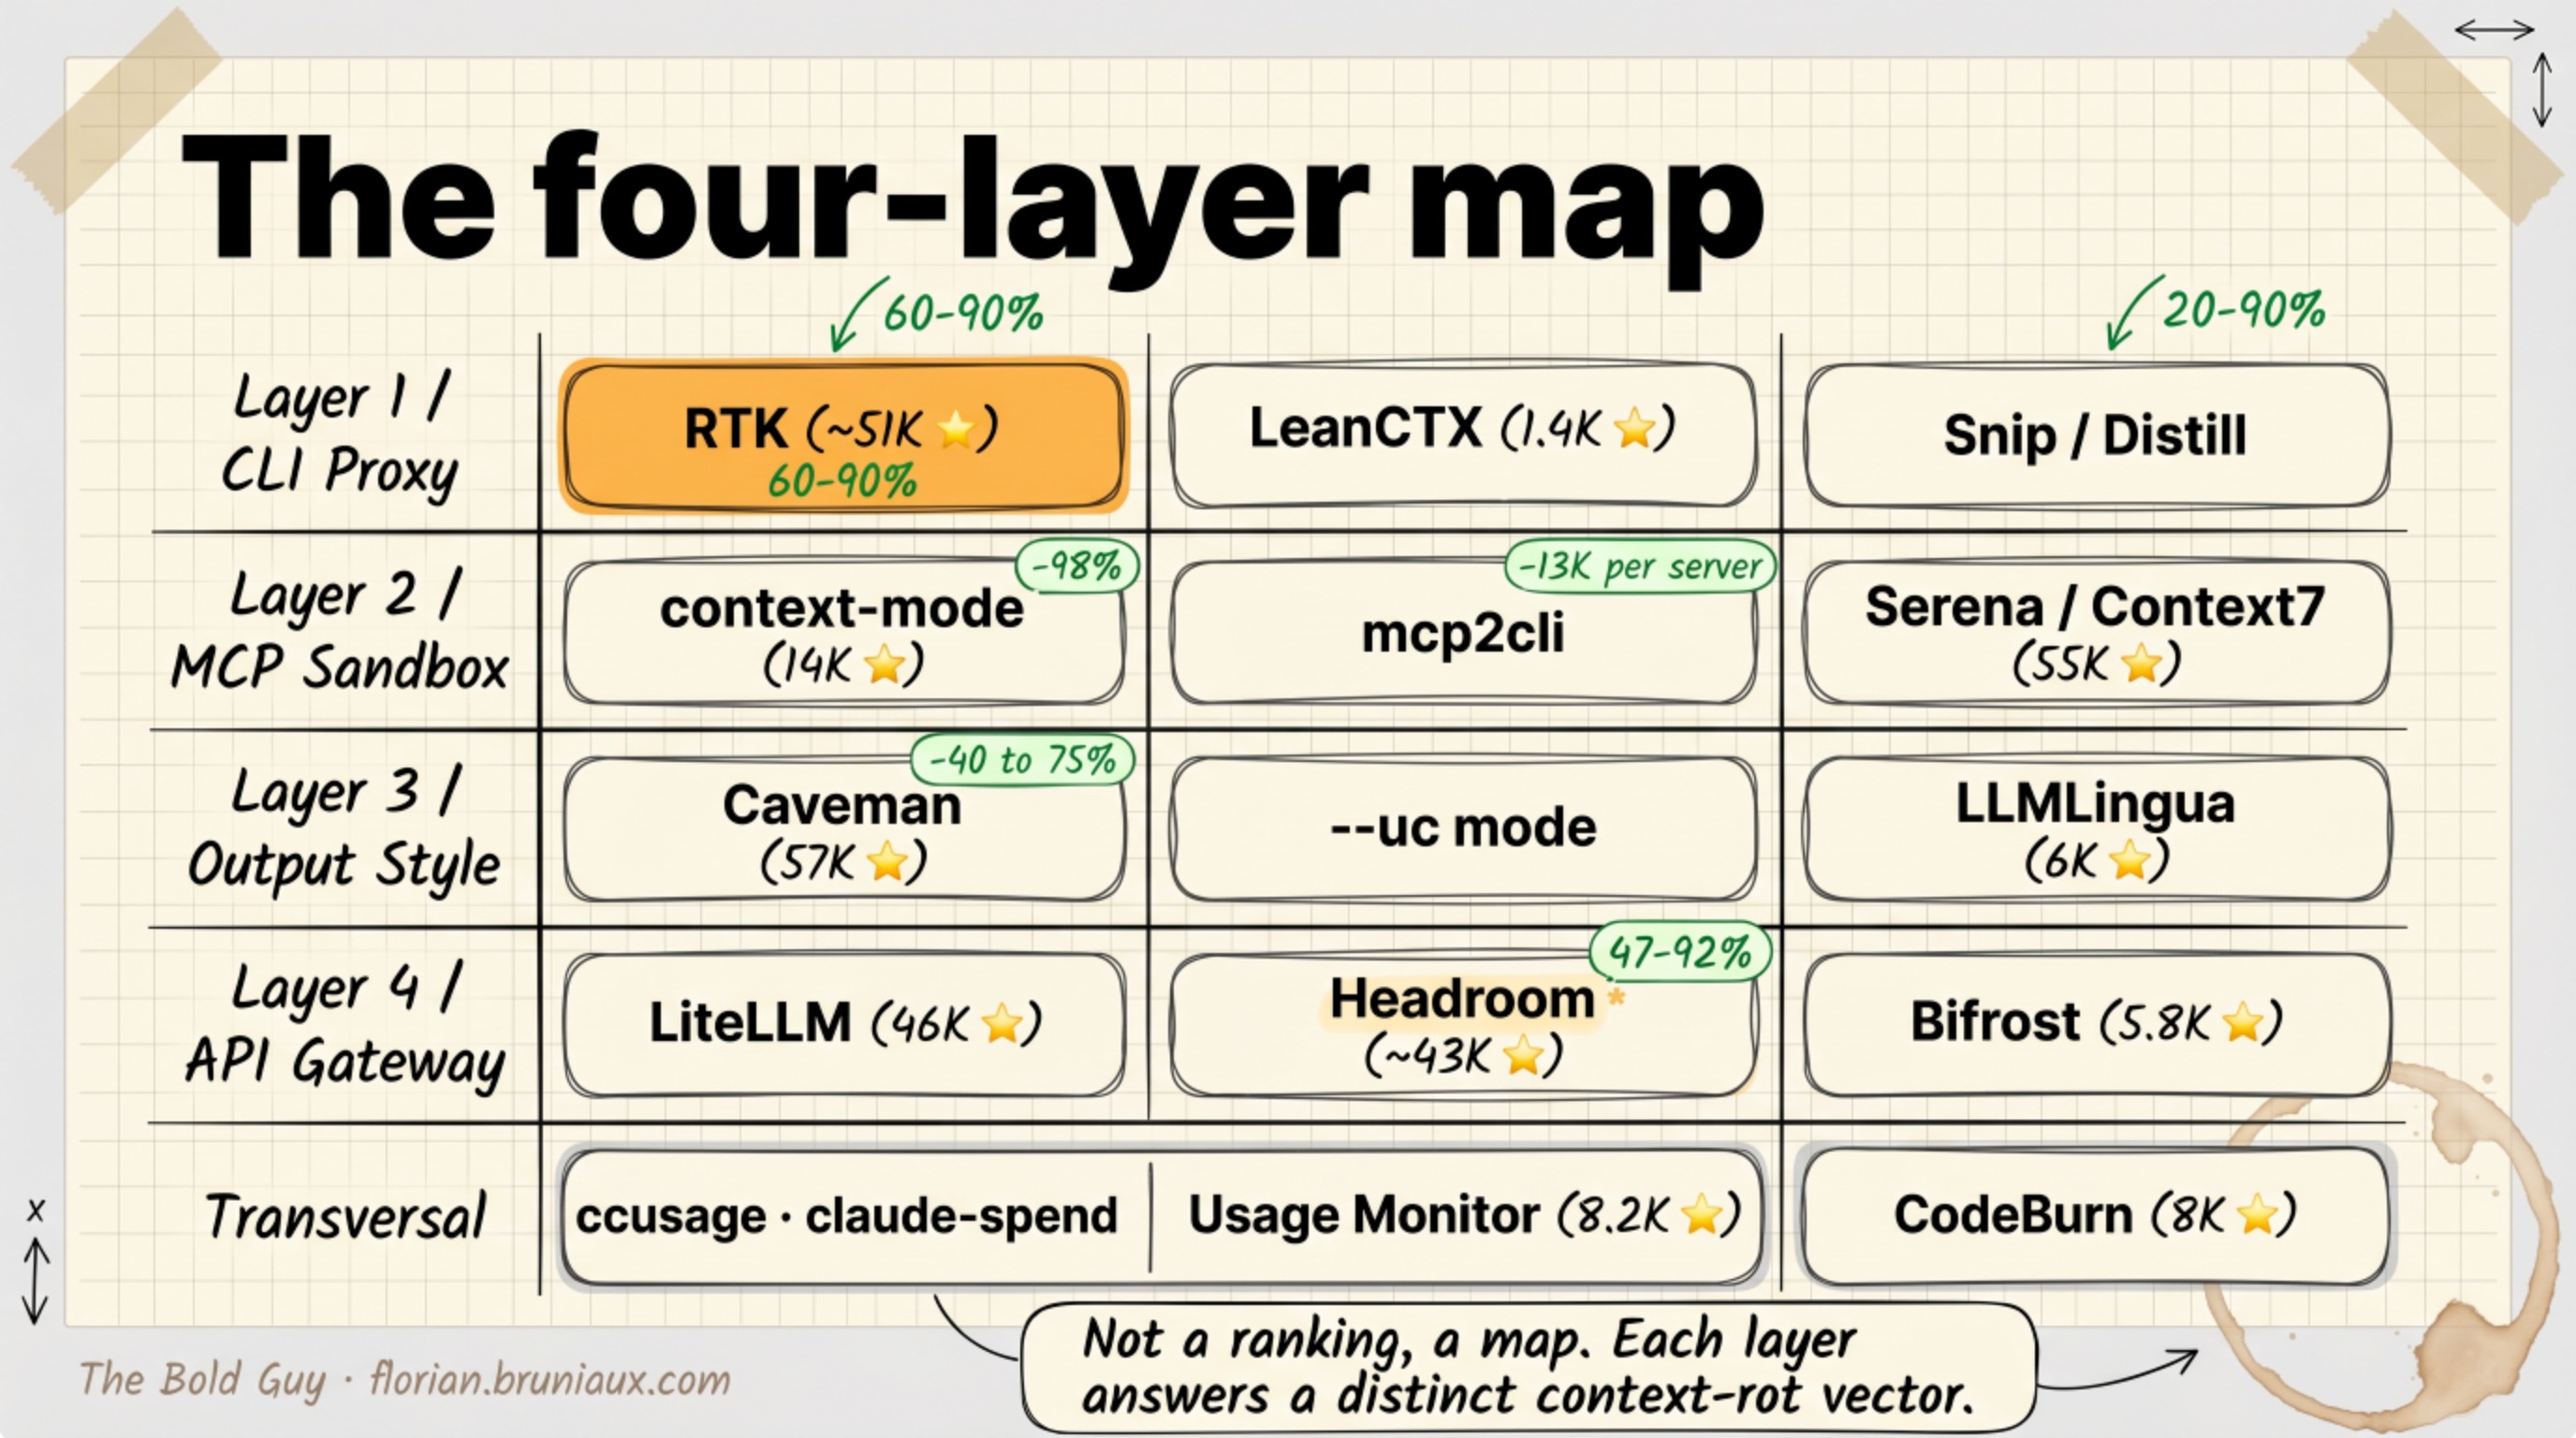
This article maps the tools that cut that noise. There are a lot of them, and from the outside they look like a crowded field of competitors all claiming the same thing. They aren’t competitors. They sit at different layers of the token flow, and each layer answers a different context-rot vector. It’s a map, not a ranking.
The four-layer map
Think of where a token can be intercepted between your command and the model’s reply. There are four places, and the tools cluster into them.
Layer 1, CLI proxy. Filters command output before it ever enters the context. This is where the easiest wins live, per-command reductions are large and setup is trivial.
| Tool | Mechanism | Reduction | Signal |
|---|---|---|---|
| RTK | Rust proxy, filters stdout before injection, native Claude Code hooks, SQLite analytics | 60-90% | ~56K stars |
| Snip | Go binary, declarative YAML rules per command | 60-90% | RTK alternative |
| Distill | Generic pipe, any CLI output to LLM-optimized answer | varies | zero config |
Layer 2, MCP sandbox. Intercepts the tool calls that dump into context, and trims the schema cost of MCP servers.
| Tool | Mechanism | Reduction | Signal |
|---|---|---|---|
| context-mode | SQLite + FTS5 session tracking, MCP output interception, “Think in Code” | up to 98% MCP output | 10K stars |
| mcp2cli | Converts MCP servers to CLI commands, avoids full schema injection | ~13K tokens/server | hidden gem |
| LeanCTX | MCP server, 10 context read modes (signatures, diff, task-filtered), file read cache | 60-99% | 1.4K stars |
| Token Savior | AST symbol index, 34 Bash output compactors, cross-session SQLite memory | -80% active tokens (author benchmark, synthetic codebase) | 1K stars |
| Serena | Semantic code indexing, symbol navigation | 40-70% | code exploration |
| Context7 | Documentation retrieval, relevant chunks only | doc-specific | 55K stars |
Layer 3, output style. Reduces the verbosity of the model’s own responses.
| Tool | Mechanism | Reduction | Signal |
|---|---|---|---|
| Caveman | Telegraphic responses, plus a PreCompact hook compressing input | 40-75% output, 46% input | ~5K stars |
| —uc mode | Symbol-based communication protocol | 30-65% output | built-in |
| LLMLingua | ML token pruning before the call, under 2% accuracy loss | 60-80% | 6K stars |
| claude-token-efficient | Single CLAUDE.md file, no code, instructs concise output | ~63% output tokens (self-reported) | 5.7K stars |
Layer 4, API gateway. Compresses history at the API boundary. Critical caveat below.
| Tool | Mechanism | Reduction | Signal |
|---|---|---|---|
| LiteLLM | Unified proxy across 100+ providers, token counting, routing | varies | 50K stars |
| Bifrost | OSS gateway, per-dev budgets, semantic caching | up to 70% via semantic caching (self-reported) | 5.8K stars |
| Headroom | Input compression + output shaper, HTTP proxy or MCP server, CCR cross-agent cache | 47% full-session, 92% code search (author benchmark, v0.5.18) | ~43K stars |
| Compresr | Background compaction at 75% context via secondary model | claims 200x | YC-backed |
Across all four sits a transversal band: observability tools (ccusage, claude-spend, cc-statistics, the 8.2K-star Claude Code Usage Monitor, CodeBurn) that don’t reduce tokens but tell you where they go. The Claude Code Usage Monitor gives real-time burn-rate predictions in the terminal. CodeBurn classifies spending by turn type across 13 categories and correlates sessions with git commits via codeburn yield, answering not “how much did I spend?” but “on what, and did it ship?”
Headroom is worth singling out before the deep-dives. At around 43,000 stars in June 2026, it is the most-starred context engineering tool outside RTK, and it doesn’t fit neatly into one layer. In HTTP proxy mode it intercepts at Layer 4, compressing the full message history before the API call. In MCP mode it acts at Layer 2, triaging tool outputs. Its Compress-Cache-Retrieve (CCR) mechanism stores compressed content in a local SQLite index, sends {{HEADROOM_TAG_N}} placeholders to the model, and retrieves the original when the model calls headroom_retrieve. The headline 92% reduction applies to code search tasks specifically; full-session measurement from the author’s own benchmark runs closer to 47%. Two open production caveats: issue #1158 documents that headroom wrap claude silently caps Claude Max users at 200K context instead of 1M; issue #1227, currently unresolved, exposes CCR endpoints without loopback protection, meaning any local web page can read cached tool outputs without authentication. The CCR retrieval TTL issue from earlier versions was fixed in v0.25.0 via the HEADROOM_CCR_TTL_SECONDS environment variable. Core compression is stable. CCR in proxy mode on a shared workstation needs caution until #1227 is patched.
Three of these deserve a closer look, because they carry most of the practical leverage. The guide keeps a fuller, regularly updated inventory of the token compression tools in its context engineering reference.
Deep-dive 1: RTK and Layer 1
Layer 1 is where most people start, because tool output is pure noise wrapped around a little signal and it’s the easiest traffic to intercept. When Claude runs git diff, pnpm list, or a test suite, the raw output is thousands of lines wrapped around a few lines that matter, and all of it enters the window and stays there, degrading every subsequent turn.
RTK is a synchronous Rust proxy that sits on Claude Code’s PreToolUse hook. Claude triggers a command, RTK intercepts it, filters the noise, and returns only what matters. To the agent, nothing looks unusual. To the context, 60 to 90% of the tokens never arrive, and on the noisiest commands more than that. A git status that costs 2,000 tokens raw drops to around 200. A vitest run drops about 92%. A git log drops 92.3%.
The number I trust most is the longitudinal one. rtk gain --all reads three months of real command history and reports 437.8 million tokens saved across 70,310 commands, a 79.2% average reduction. That’s not an estimate from a benchmark, it’s the bill from actual usage. The whole thing is one 4.8MB Rust binary, no dependencies, sub-10ms startup. It crossed roughly 56,000 GitHub stars in five months, which is less a startup finding a market than a market finding its tool.
$ rtk gain --all   (monthly breakdown)

Month       Cmds      Input     Output      Saved   Save%
──────────────────────────────────────────────────────────
2026-03     6957     100.6M       8.8M      91.8M   91.3%
2026-04    20789     230.7M      41.6M     189.2M   82.0%
2026-05    32099     178.9M      34.8M     144.1M   80.6%
2026-06    10465      42.8M      30.3M      12.6M   29.5%
──────────────────────────────────────────────────────────
TOTAL      70310     553.0M     115.5M     437.8M   79.2%
Three months of real command history: 70,310 commands, 437.8M tokens that never reached the context. The recent dip is honest too. As more of a session is the model’s own output, which a CLI proxy can’t touch, the headline rate falls, exactly what the cost breakdown later in this article predicts.
Deep-dive 2: the MCP tax
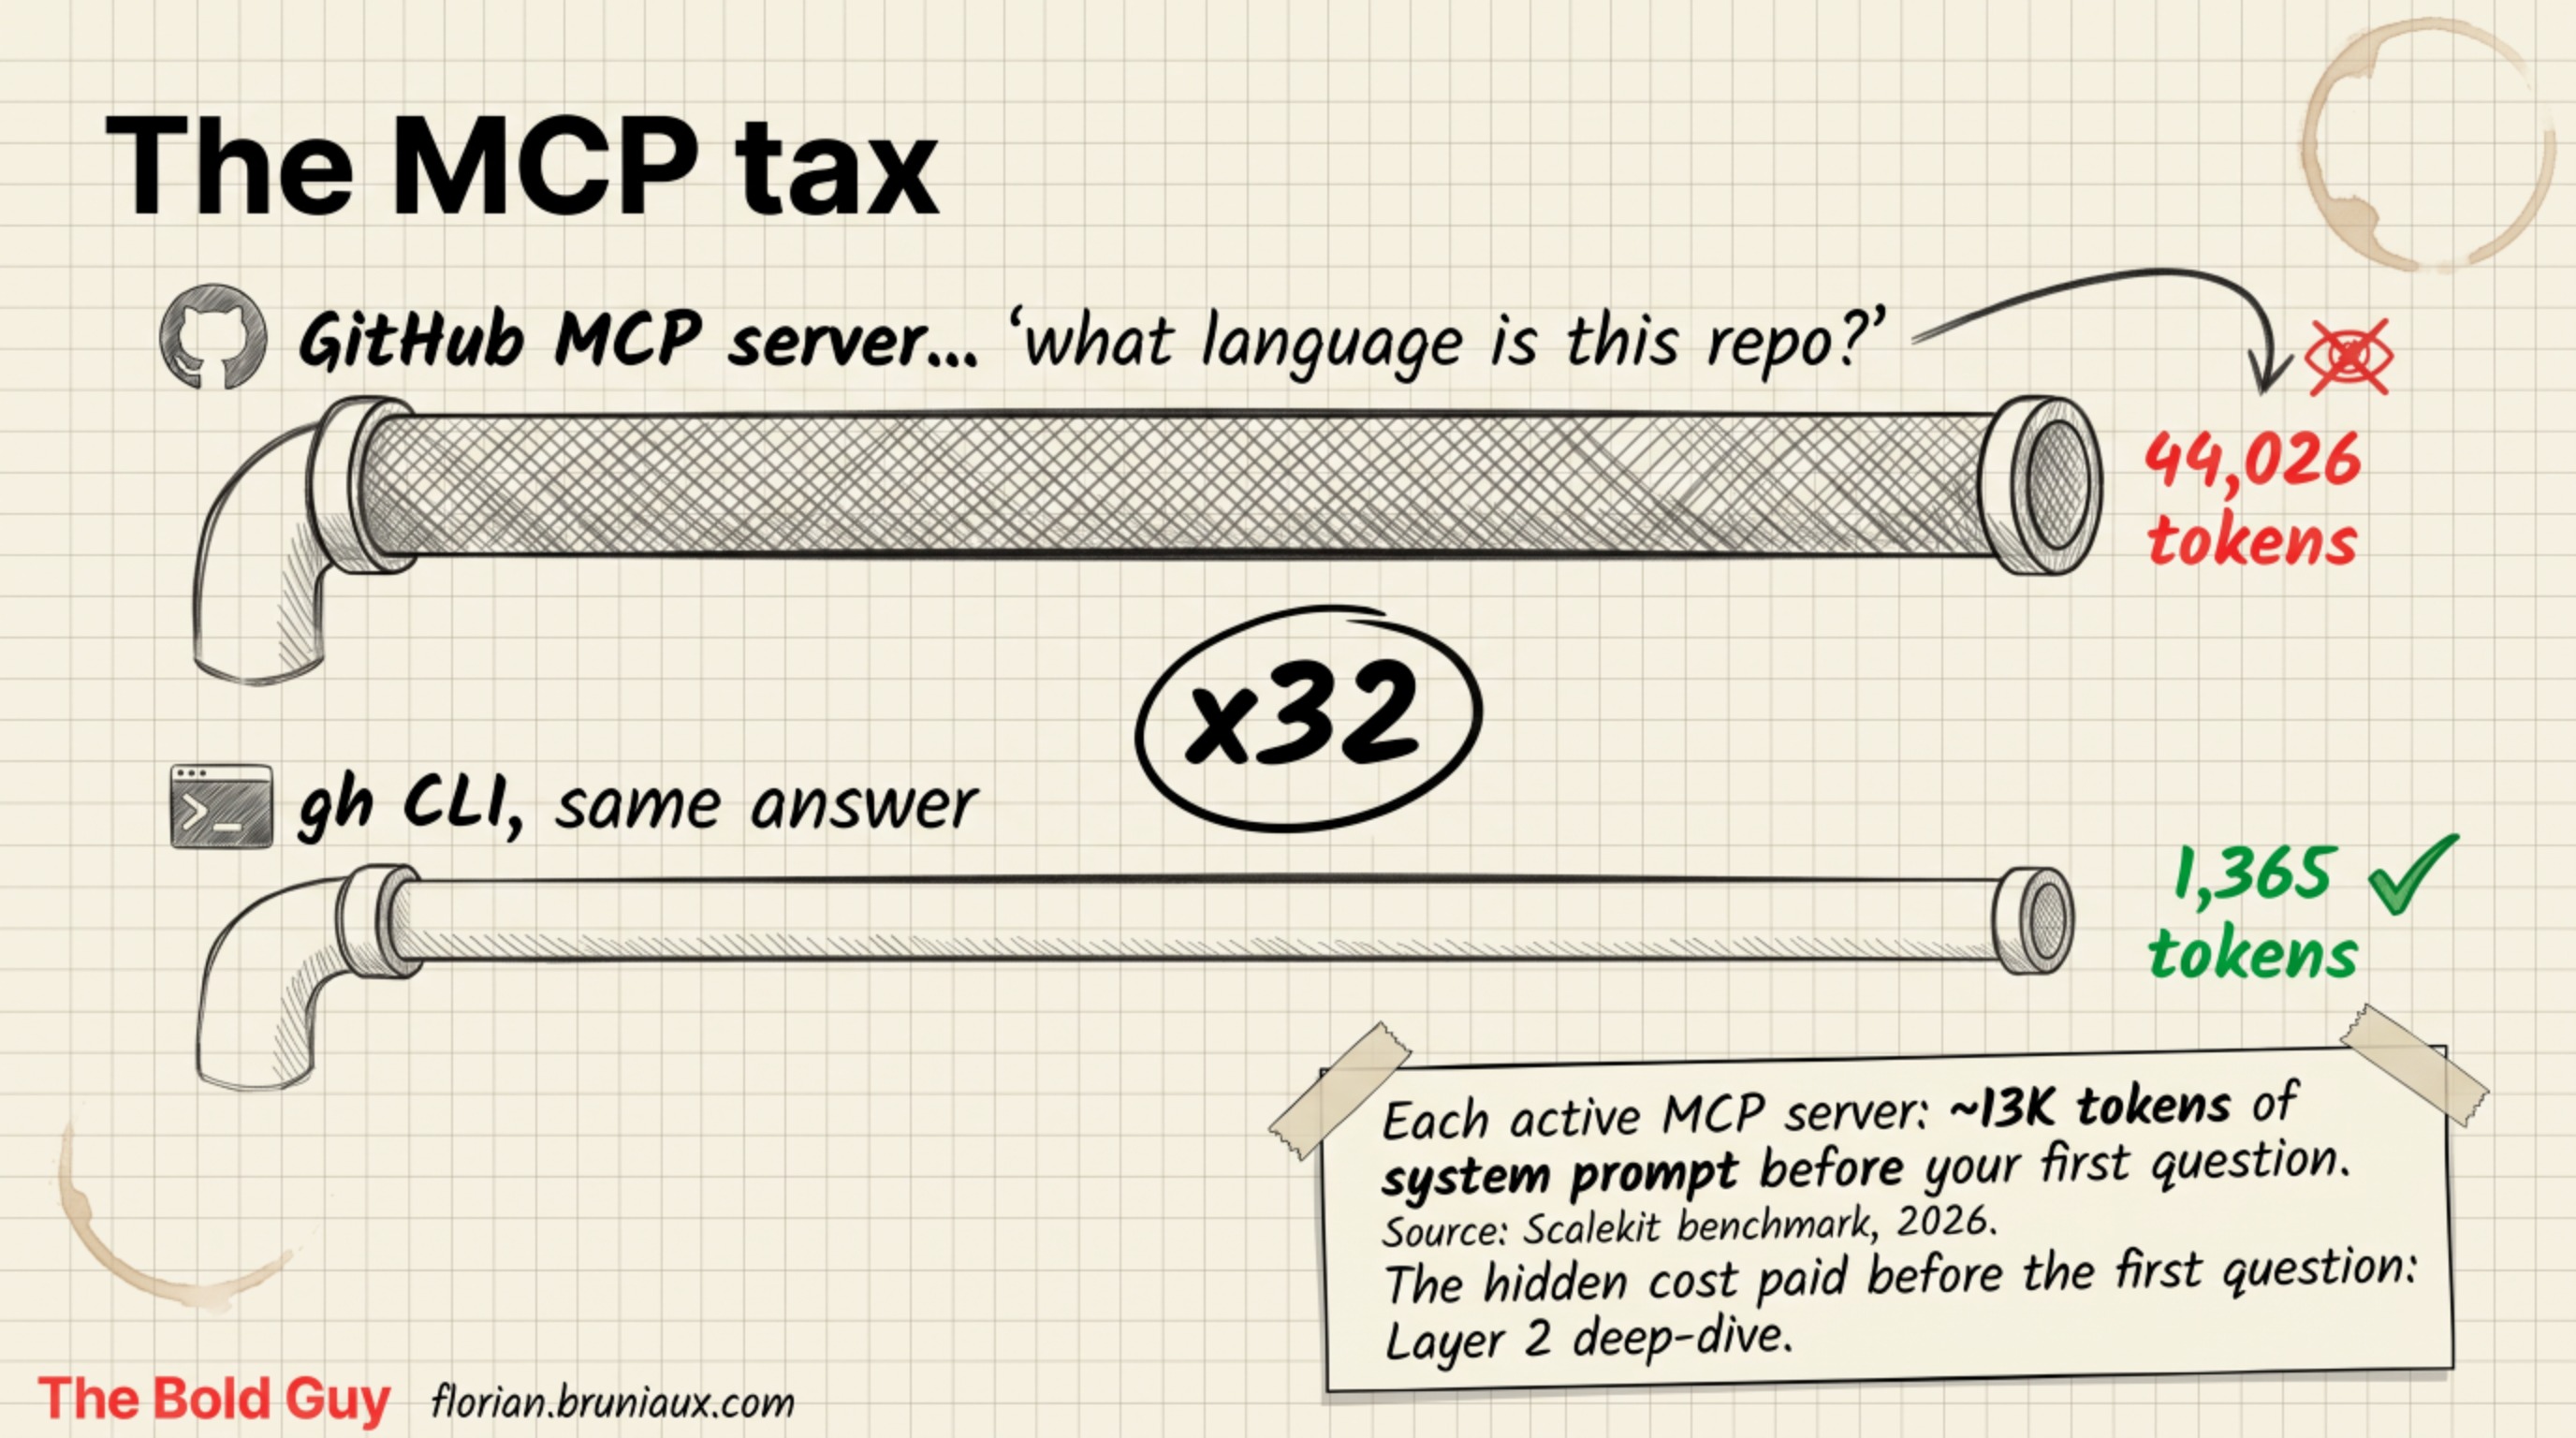
The second hidden cost is one most people never see, because it’s paid before the first question. Every active MCP server injects its full tool schema into the system prompt, every turn, whether you use the tools or not.
The benchmark that makes it concrete comes from Scalekit. Asking “what language is this repo?” through the GitHub MCP server, which exposes 43 tools, cost 44,026 tokens. The same question answered with the gh CLI cost 1,365. A factor of 32, for an identical answer. Each active MCP server runs around 13K tokens of system-prompt overhead before you’ve typed anything.
The token count is only part of the problem. On IFTTD, Zineb Bendhiba argued that each additional tool exposed to a model also raises the hallucination rate, because the model must reason across a wider option space on every turn (ep 326). A related design principle from Frédéric Barthelet: build MCP tools as complete user journeys rather than atomic endpoints, because five sequential tool calls each multiply the model’s error probability, while a single well-scoped tool compresses that risk into one decision (ep 329).
At ManoMano, where 250 developers run Claude Code in production, Jocelyn N’takpe described an explicit rule that follows the same logic: anything that can be implemented as a native Claude Code skill should be, because skills carry no schema overhead and run without MCP round-trips (ep 346). MCP servers stay reserved for integrations that genuinely cannot be expressed any other way.
The fix has two halves. The mcp2cli pattern converts MCP servers into plain CLI commands, moving the schema cost client-side and cutting it 96 to 99%. Claude Code also addresses part of this natively with deferred tool loading, where schemas load on demand past a context threshold rather than all at once. One community report combined MCP cleanup with mcp2cli and compression scripts and took a session from 92K tokens to 5,500, a 94% cut, mostly by not paying for schemas nobody was using.
The practical move is duller than the number suggests: run claude mcp list, look at what’s actually loaded, and turn off the servers you’re not using this week. Most setups carry two or three servers they forgot they installed.
Deep-dive 3: output, and the Max/Pro blind spot
Layer 3 is smaller but real. Caveman strips the hedging and filler from responses for a 40 to 75% output reduction, and its PreCompact hook compresses input by around 46%. The built-in --uc mode does something similar with a symbol protocol. The practical split: Caveman for interactive sessions where you still read the output, cutting it around 40% in practice, and --uc for batch or agentic runs where density beats readability, closer to 65% on those runs specifically. At the opposite end of that complexity spectrum, claude-token-efficient is a single CLAUDE.md that instructs Claude to be concise: zero install, zero code, and 5.7K GitHub stars that measure exactly how much demand exists for that level of simplicity. The ceiling is real (output tokens only, no effect on file reads or input), but so is the signal. These gains are modest next to Layer 1, but they compound: a more compressed session leaves more room for the rules from part two to stay in the window.
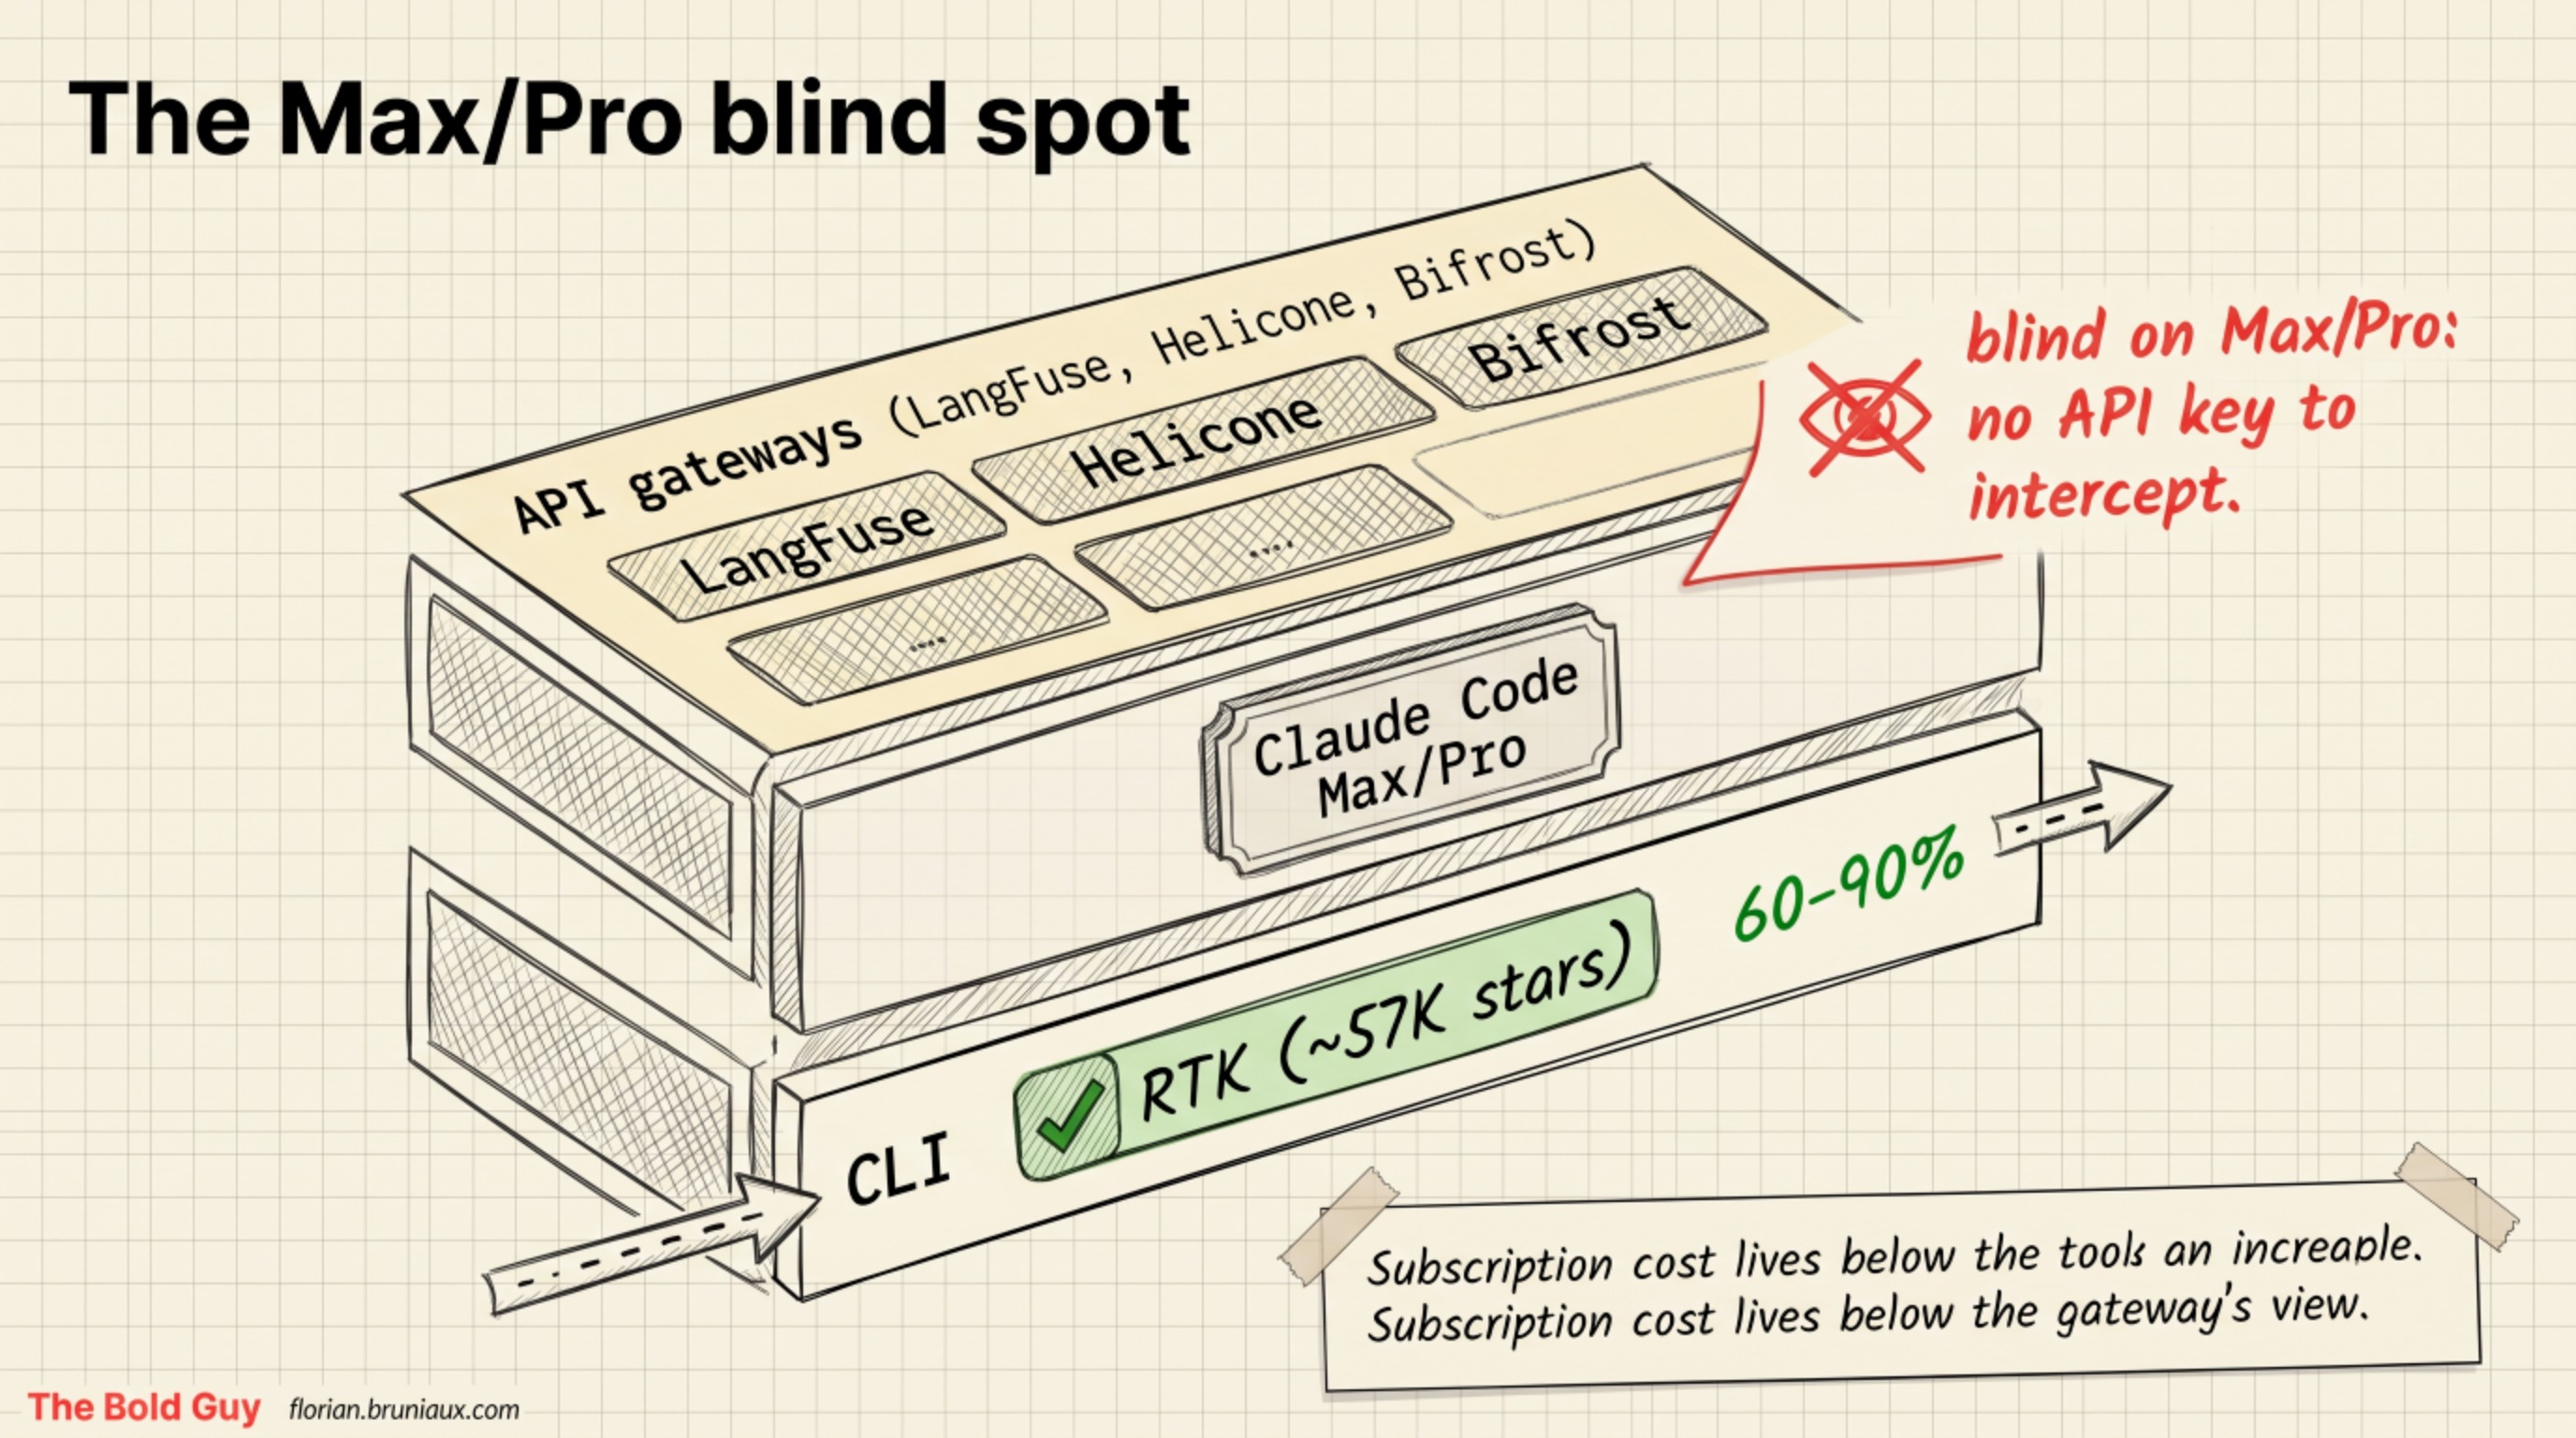
Layer 4 is where the interesting trap lives. Every API gateway, LangFuse, Helicone, Bifrost, and the rest, works by intercepting API calls. That’s the whole mechanism. On Claude Code Max and Pro, there is no API key to intercept. Claude connects directly to Anthropic’s servers with subscription credentials, and the gateway sees nothing. These tools aren’t immature about it, they’re structurally blind to it. For the large population of developers on Max and Pro, the entire enterprise observability layer is dark, and the only thing that can give you per-session analytics is a tool operating at the CLI layer, below the billing boundary.
Cost-aware routing at the prompt level is the approach that survives the Max/Pro blind spot. On IFTTD, Antonio Goncalves described deploying a routing model that assesses prompt complexity and dispatches to the appropriate model tier, reporting that clients who adopted this pattern halved their inference bill (ep 357). A lightweight classifier doing that dispatch works at the application layer, with or without an API key to intercept.
Cost control on a subscription comes from different levers. Running a dual-instance setup, an Opus planner directing Sonnet executors, costs roughly $100 to $200 a month against $500 to $1K for Opus doing everything. Fast Mode trades quota for speed, it runs Opus with faster output and can chew through your Max allowance noticeably faster, so toggle it off with /fast when you’d rather conserve it. Per-task budget caps keep a runaway session from eating the week, with rough tiers of $2 for tests and docs, $5 for a medium refactor, $10 for architecture work. When a session nears its cap it summarizes what is left rather than stopping mid-task, so you lose tokens, not the thread. None of these show up in a gateway dashboard, because the gateway can’t see the traffic.
What doesn’t work, and measuring first
Before any of that, the deepest measure-first principle is whether you need a model for the specific task. On IFTTD, Charles Cohen described a content-moderation system where rule-based symbolic AI outperformed LLMs on precision, latency, cost, and explainability in production, because the task was deterministic enough for rules to win (ep 333). Every token you never send is free and adds no noise to the context. A complementary finding from production: N’takpe at ManoMano cited a Berkeley study showing that 94% of agent errors would have been caught by a compilation step, which drove their team to migrate parts of their stack to strict TypeScript specifically to improve Claude Code output reliability (ep 346). A typed codebase is infrastructure for the agent layer, not just a style preference.
A lot of clever-sounding token tricks fail in practice, and it’s worth knowing which, so you don’t waste a weekend on them. Base64 and zlib compression fail because the model doesn’t decode binary. Binary diffs aren’t interpretable. Emoji encoding costs more than it saves, each emoji running 2 to 3 tokens. Regex redaction of secrets carries a 60%-plus miss rate, worse than useless because it feels safe. Path-prefix elision backfires when the model copies the shortened paths verbatim and the commands fail.
One honest caveat about the headline numbers, including RTK’s: most CLI-proxy savings are measured in characters or bytes, not BPE tokens. The two correlate well on noisy CLI output, but they aren’t identical, and an enterprise-grade benchmark should validate against the actual tokenizer rather than trust the byte count. I’d rather say that than quote a number I can’t fully stand behind.
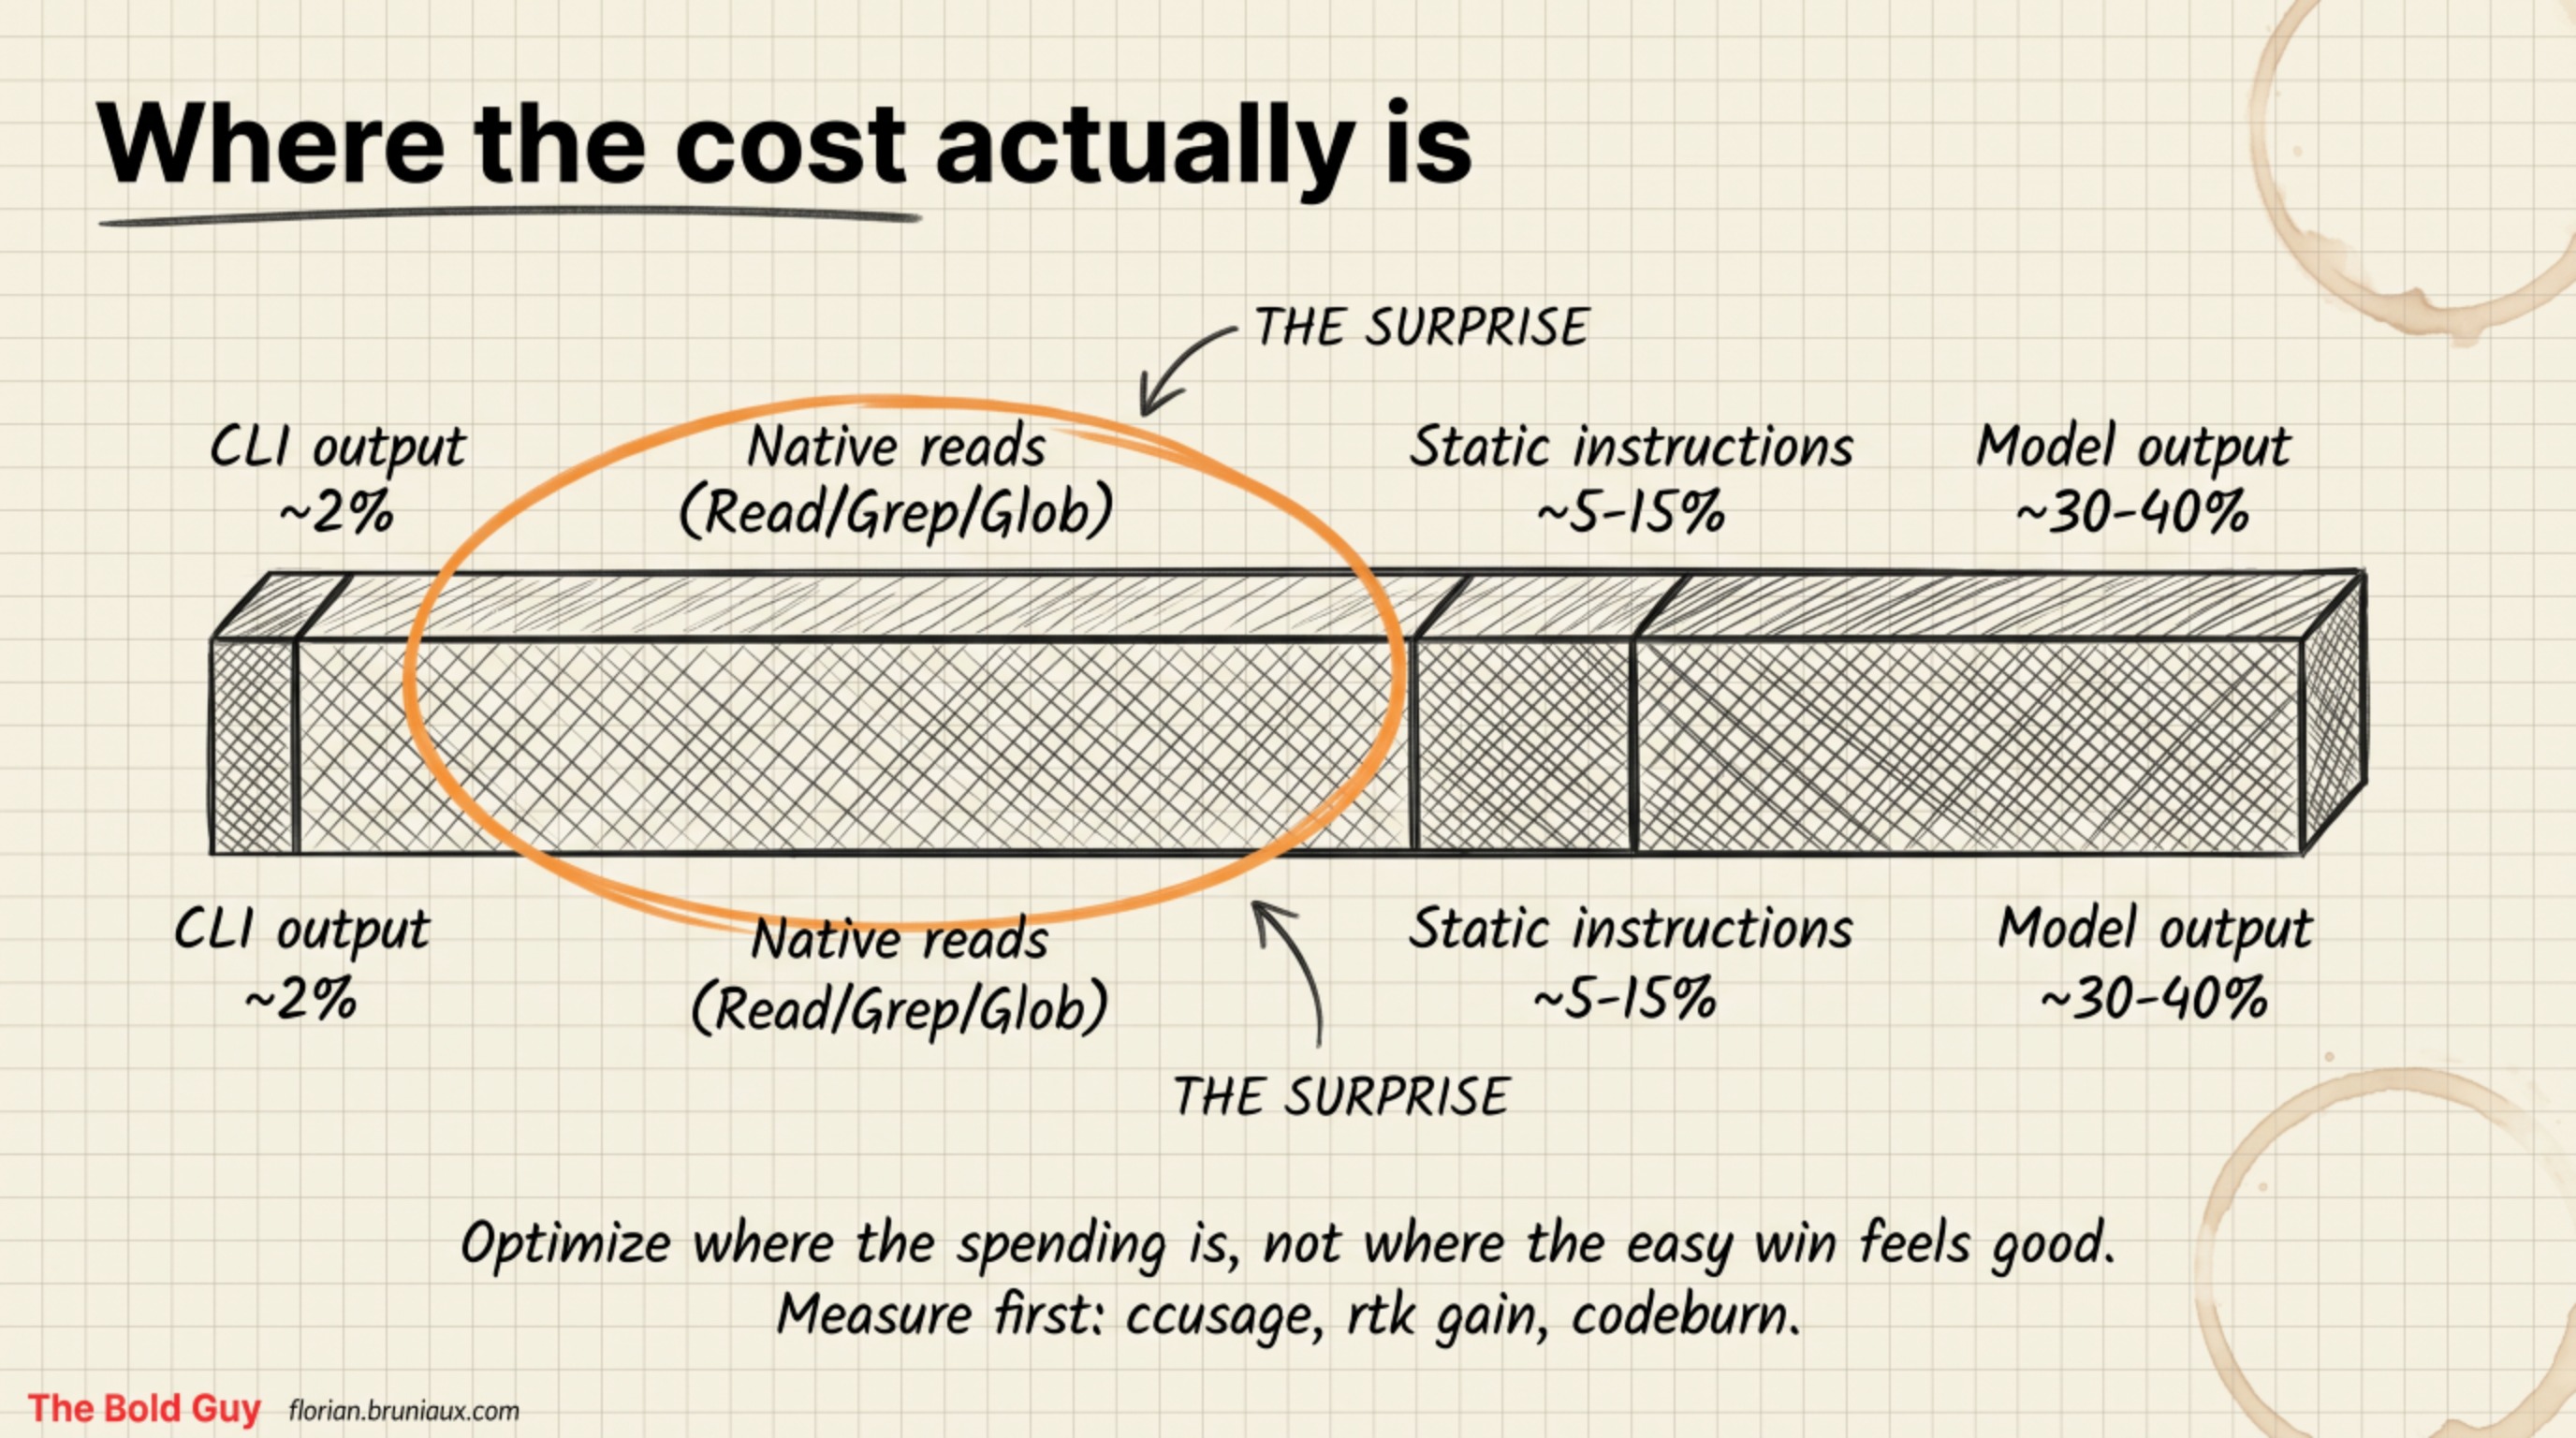
And the breakdown that reframes the whole exercise: when you actually measure a session, CLI output is only around 2% of the total token volume. That is the honest counterweight to Layer 1. It is the cheapest, noisiest traffic to cut, which is why the per-command reductions run so high, but it was never the bulk of the bill. Native file reads (Read, Grep, Glob) are 40 to 60%, the single largest cost, and most tools don’t touch them. Static instructions are 5 to 15%. The model’s own output is 30 to 40%. This is the FinOps lesson over folk wisdom: you optimize where the spending is, not where the easy win feels good. Run ccusage, or rtk gain, or codeburn, and look at your own breakdown before you install anything. For tracking this across a team rather than one machine, the guide’s team metrics page covers what to measure and how.
What to do Monday
Three actions, escalating effort, all visible by Monday morning.
Run rtk gain (about 2 minutes). It reads your command history and shows the real waste, per command and per session, pulled from actual usage, not a benchmark estimate.
Run claude mcp list and disable the servers you aren’t using (about 5 minutes). That alone reclaims the MCP tax on every future session.
Add two terse rules to CLAUDE.md (about 10 minutes): confirm success in one line, explain only on errors. That trims the output layer for free.
Together, depending on how much MCP overhead and output bloat you were carrying, these often land a 40 to 60% reduction on your next session, with no model change and no workflow change. The science in part one explains why that also makes the output better, not just cheaper. The discipline in part two keeps it that way over months. This is the layer where you prove it on the bill. And if you want the wider view, part four covers the roles this whole practice created, from context engineer to the jobs that didn’t exist three years ago.
From the field, via IFTTD episode transcripts: Zineb Bendhiba, ep 326 on tool count and hallucination; Frédéric Barthelet, ep 329 on MCP tool design as complete journeys; Antonio Goncalves, ep 357 on model routing; Charles Cohen, ep 333 on symbolic AI beating LLMs in production; Jocelyn N’takpe, ep 346 on skills-first configuration at 250-developer scale.
If you’ve measured your own token breakdown and it looks nothing like the 2 / 40-60 / 5-15 / 30-40 split above, I genuinely want to see it. The shape of real usage is more varied than any single study captures.
Talked about in
Where I covered this live or on a podcast.