AI coding productivity at scale: 15-20% measured, 20x in one team
Stanford measures a 15-20% coding gain after rework. Stripe's reported 1,300 weekly pull requests show a different productivity signal.
Jump to summary
Written by Florian Bruniaux
AI Founding Engineer at Méthode Aristote, 13 years scaling engineering teams from developer to CTO. Builds open-source developer tools, see what else I've shipped.
TL;DR
| Claim | Number | Source |
|---|---|---|
| Net productivity gain, rework subtracted | 15-20% | Yegor Denisov-Blanch, Stanford AI Lab, ~100,000 developers, ~600 companies, cited on the AI Native Dev podcast, January 2026 |
| Gross code generation before rework | 30-40% | Same Stanford dataset |
| Realistic range across DX’s customer base | 20-30%, one customer (Intercom) at 41% | Justin Reock, Deputy CTO at DX, August 2025 |
| AI-generated PR merge rate vs. human | 60% vs. 80% | Nick Arcolano, Head of AI & Research at Jellyfish, 250,000 developers tracked, June 2026 |
| ”2x requests might mean 2x bugs” | Independent warning, same conclusion | Thomas Bentkowski, Product Manager at Doctolib, September 2025 |
| Floor case, insufficient review | Rework reported, no net figure given | Max Sumrall, Software Engineer at Picnic, Devoxx, April 2026 |
| Ceiling case 1: fully autonomous PRs | 1,300/week as reported at the time, human review still mandatory | Steve Kaliski, Stripe, corroborated on stripe.dev, Stripe Sessions 2026, and the How I AI podcast |
| Ceiling case 2: one team’s throughput jump | 3.5 to 70 PRs/engineer/week, GPT-5.2 to GPT-5.5 (GPT-6 family not covered) | Ryan Lopopolo, Member of Technical Staff at OpenAI, June 2026 account, “on my team” |
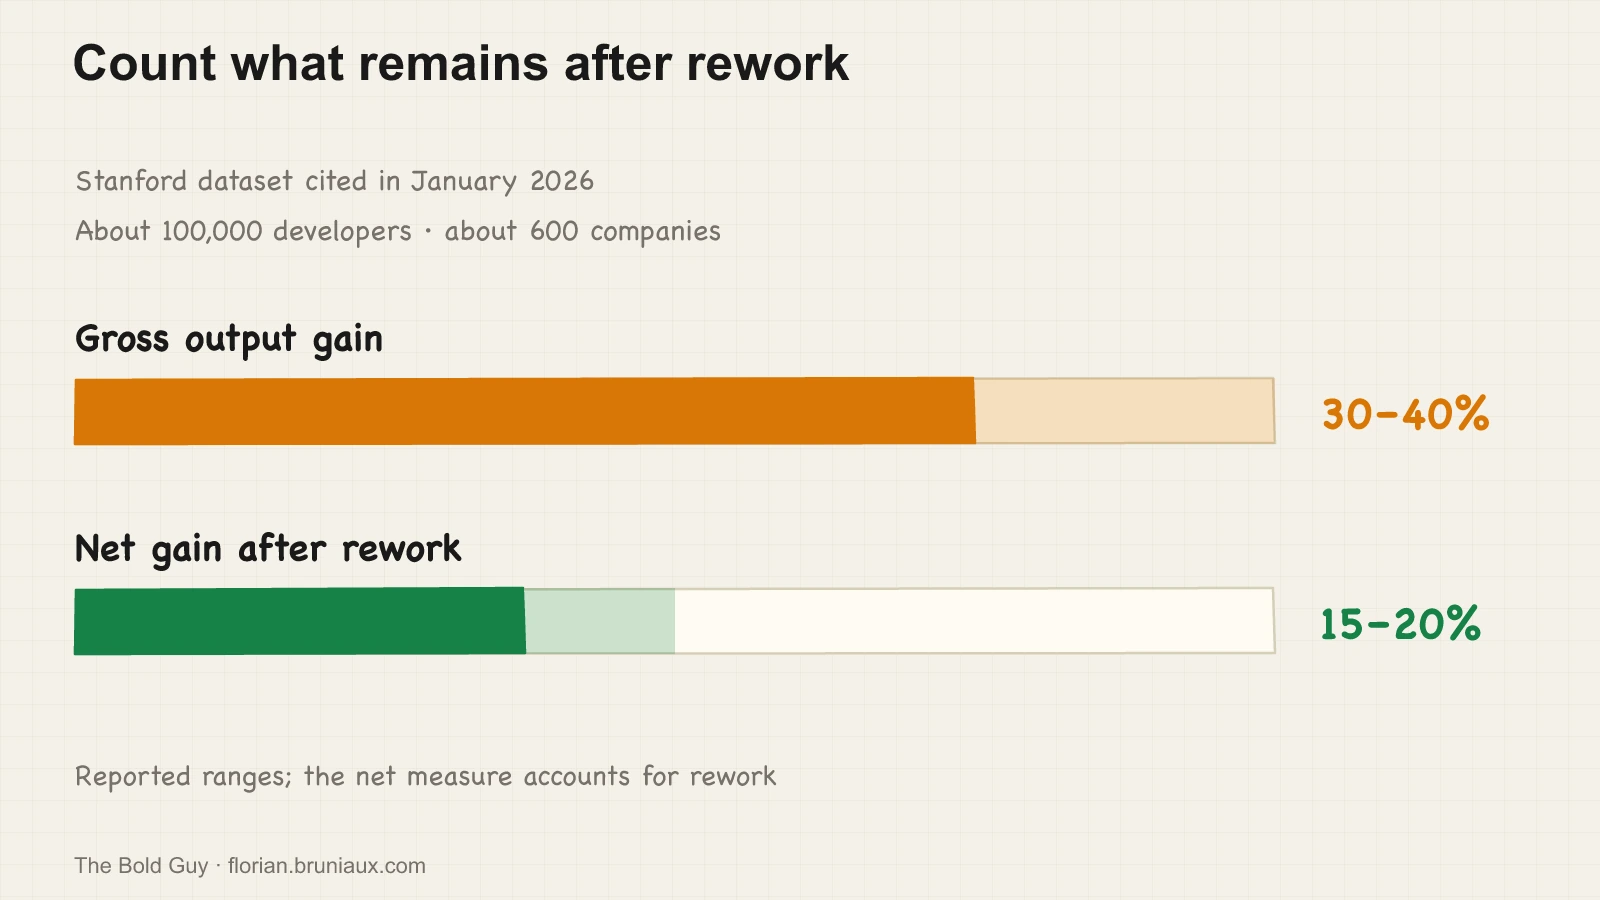
In January 2026, the AI Native Dev podcast built an episode around engineers from four companies that don’t normally share a stage: Meta, Coinbase, ServiceTitan, and ThoughtWorks. Each guest talked through their own AI adoption story. But the number that anchored the whole episode didn’t come from any of the four. One guest reached for outside data to make the point land: a Stanford study tracking nearly 100,000 developers across roughly 600 companies found that AI coding tools boost gross code output by 30 to 40%. Once you subtract the code that gets thrown away and rewritten, the net gain settles at 15 to 20%.
That study belongs to Yegor Denisov-Blanch, a research scientist at the Stanford AI Lab who has spent three years running what he describes as one of the largest ongoing measurements of software engineering productivity in the world. His finding matters less for the headline percentage than for what it explains. A 30-40% jump in raw output looks spectacular on a dashboard. Track what ships after fixing, rewriting, and cleaning up what the AI produced, and roughly half of that number evaporates. The gap between those two figures is the gap between gross output and what survives rework.
A second team, the same range
Independent confirmation of that range had surfaced five months before that January 2026 episode, from a source with no connection to Denisov-Blanch’s research. Justin Reock, Deputy CTO at DX, put a number on what his platform sees across its own customer base in an August 2025 conversation: “more realistically, looking at numbers like 20, 25, 30% increases in velocity, I think is a good number, and it’s certainly making an impact.” He drew a hard line against anything bigger. “It’s not the 100x improvements,” he said. “That’s a lot of information that’s very good for creating YouTube subscribers and upvotes, but not necessarily increased productivity for organizations.”
One customer beat that range by a wide margin. DX’s public data shows Intercom achieved a 41% increase in AI-driven developer time savings, which Reock characterized as an outlier rather than a typical result. Read together, DX’s numbers frame the Stanford figure from a different angle: 20-30% as the working range most teams should expect, 41% as what a well-run outlier can hit, and neither one within reach of the multipliers vendors advertise.
Where the volume goes wrong
Nick Arcolano, Head of AI & Research at Jellyfish, sits on a dataset that tracks 250,000 developers across the industry. In a June 2026 conversation, he laid out a failure mode that helps explain why volume overstates output: AI-generated pull requests get merged at a lower rate than human-written ones. “The average for Q1 for humans was about 80% of pull requests that were open ultimately got merged,” he said. “What we see with agentic PRs is 60/40 instead of 80/20. So you’re talking about double the amount of PRs that are kind of dying on the vine.” Twice the volume of code doesn’t translate into twice the shipped output when a much larger share of that volume never survives review.
A different team reached the same conclusion from the opposite direction, nine months earlier and with no connection to Jellyfish’s dataset. Thomas Bentkowski, Product Manager at Doctolib, described his own team’s internal metric in September 2025: “if we are producing twice as many requests compared to three months ago, it means that we double our productivity, right? Well, no, because we might as well have doubled the number of bugs as well. So doubling the number of requests alone doesn’t mean anything.” Two teams, two datasets, and no shared source produce the same warning. Raw request volume is a vanity metric until someone checks what happens to it downstream.
Bentkowski’s own team gets the deepest check this series runs on any single company: Part 7 follows Doctolib’s 30-to-600 rollout through two corroborating talks, then separates it from three other Doctolib initiatives documented elsewhere.
The floor, when nobody checks
Volume without enough review has a reported floor. At Devoxx, Max Sumrall, a software engineer at Picnic, described what happened when his team let AI-generated code ship without enough scrutiny in April 2026: “the code is shipped and then it needs to be touched again and again and again to actually make it work.” Sumrall describes the same kind of rework cost the Stanford study measures, without reporting a net figure. Picnic’s case shows what an average conceals: a mean of 15-20% still allows for teams that land well below it. This comparison attributes most of the difference to process; it does not measure model quality separately.
The two numbers that don’t belong on the same chart as the rest
Two figures from this same body of reporting run far past 15-20%, and both are cited as if they represented the norm rather than the extreme.
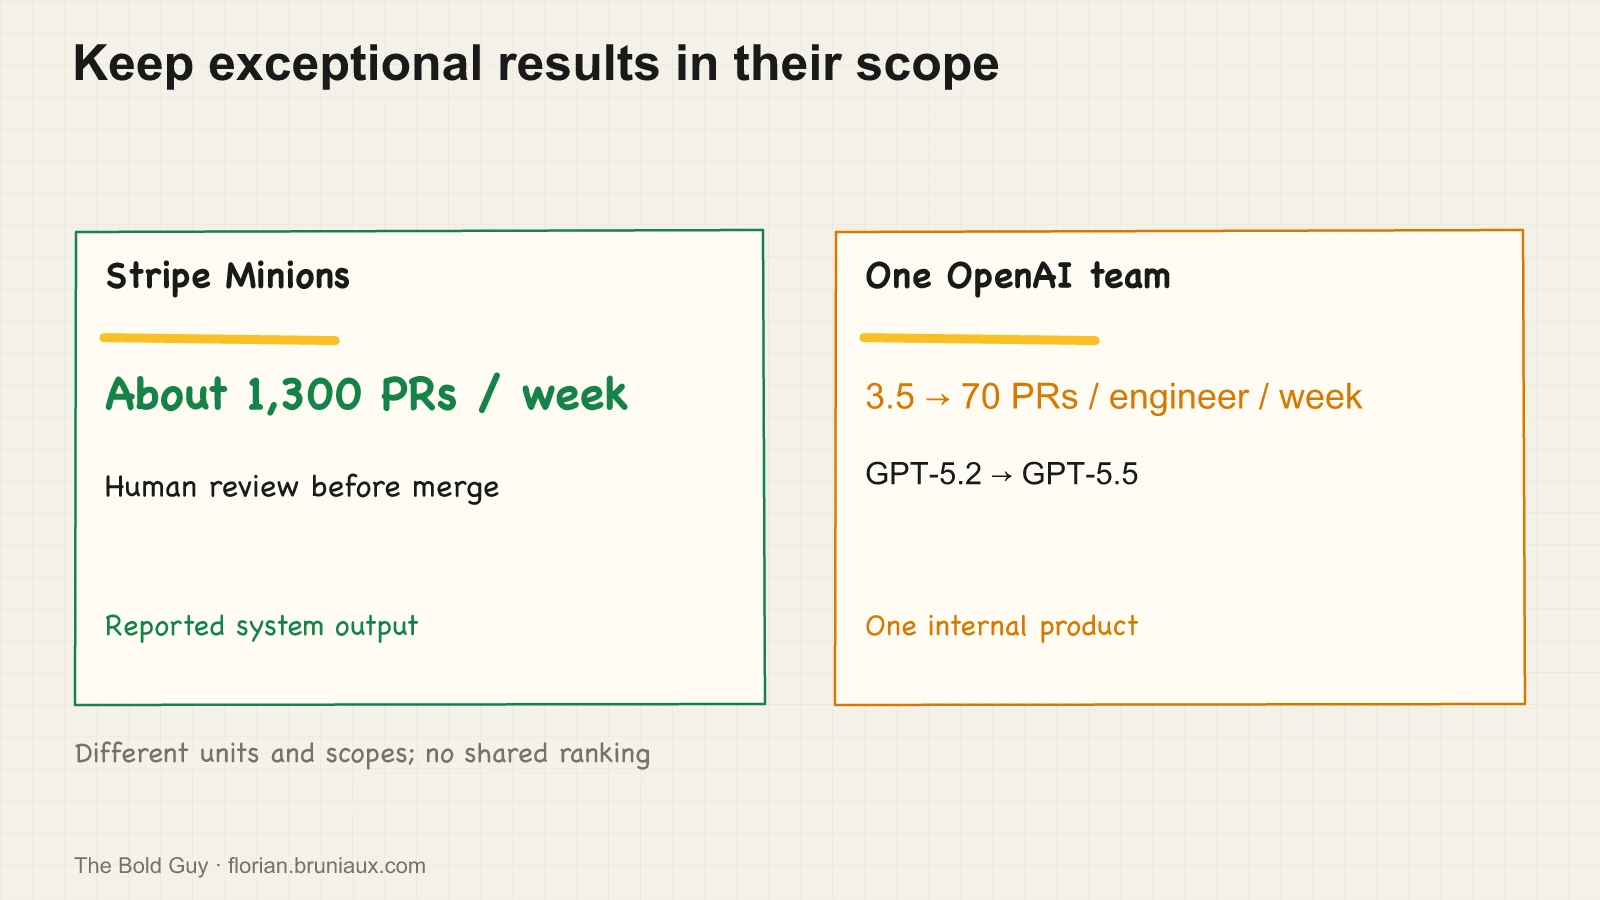
Stripe’s internal coding agent, called Minions, was reported at the time to generate roughly 1,300 pull requests a week without a human writing the code, according to Steve Kaliski, a Stripe engineer who described the system on three separate occasions: Stripe’s own engineering blog, a keynote at Stripe Sessions 2026, and an episode of the How I AI podcast. All three converge on the same number and the same caveat: humans stop writing the code, but human review before merge stays mandatory. What Stripe claims is narrower than autonomy: a coding phase with no human keystrokes, sitting in front of a review phase that hasn’t gone anywhere.
The second figure comes from one specific OpenAI team. Ryan Lopopolo, a Member of Technical Staff at OpenAI who is associated with the term “harness engineering,” described his own team’s trajectory in a June 2026 conversation: “at the beginning of sort of the 5.2 era, we were looking at maybe three and a half PRs per engineer per week on my team. Now with 5.5, we’re looking at 70.” That’s a jump attached explicitly to one team building one internal product, tracked across two model generations. The account names GPT-5.2 and GPT-5.5 and covers no later model, including the GPT-6 family OpenAI now lists. It also does not isolate the effect of the model upgrade from changes to the harness and workflow. It says something real about what harness engineering can produce inside a specific, deliberately instrumented setup. It says nothing about what an average OpenAI engineer, or any other company’s engineer, should expect to see on their own dashboard next quarter.
Both numbers are true for their scope, and both lose it when repeated on conference stages, until “one OpenAI team going from 3.5 to 70 PRs a week” quietly becomes “OpenAI is 20x more productive now.”
A third case arrived in September 2026 with the same shape and one difference worth keeping. In an engineering account of its own CI load, Anthropic reports that its engineers “on average ship 8x as much code per quarter as they did from 2021-2025” and that “Claude authors 80% of that code and it also plays a large role in reviewing and approving PRs as well”. No counting methodology is published for the 8x, and “code per quarter” carries no stated unit, so the multiple cannot be reconstructed or lined up against Stanford’s rework-adjusted 15-20%. The difference is that the thing being measured is code volume, and Anthropic says so rather than letting the reader infer productivity. Addy Osmani, writing about the same numbers, keeps the caveat that usually falls off on the third repetition: “Lines of code isn’t (of course) a direct measure of value.” An honest volume measure is still a volume measure. It belongs next to Stripe’s 1,300 weekly pull requests (as reported at the time), not next to a merge rate or a net gain.
The gap that sets up the next question
Put the two registers side by side. The measured average, from Stanford’s 100,000-developer dataset and confirmed independently by DX, sits at 15-20%, with a reported floor well below that at a team like Picnic that shipped without enough review. The case-specific extremes are Stripe’s 1,300 autonomous pull requests per week (as reported at the time) and one instrumented OpenAI team’s 20x jump from 3.5 to 70 pull requests per engineer per week.
Neither number is fake. Both are being spent against, right now, by companies deciding how much budget an AI coding rollout deserves. Part 1 of this series tracked what an agent costs to run once volume shows up. Part 2 showed why almost nobody can put a verified number on the return side of that spending. The gap between a 15-20% measured average and one team’s 20x jump is what a FinOps discipline has to budget against. Someone has to decide which number their own team’s budget gets built against, and defend that choice with data rather than the headline that sounded best in the room. AI velocity is bidirectional covers the twin problem on the delivery side, shipping faster and accumulating debt faster in the same motion. The next part turns to FinOps: who owns the AI coding budget, and how routing decisions get tested against it.
YSNK
(You should now know)
- The measured net productivity gain, Stanford’s ~100,000-developer dataset, is 15-20% once rework is subtracted from a 30-40% gross output jump
- DX’s own customer data independently confirms a 20-30% working range, with one outlier customer (Intercom) at 41%
- AI-generated pull requests merge at a lower rate than human-written ones, 60% versus 80% per Jellyfish’s 250,000-developer dataset, which is why raw request volume overstates real output
- Stripe’s 1,300 autonomous PRs a week (as reported at the time) and one OpenAI team’s jump from 3.5 to 70 PRs per engineer per week are both real, and both are case-specific extremes, not the industry norm
- A low floor exists too: Picnic’s Max Sumrall reported AI-generated code that shipped without enough review and needed repeated rework
Go Further in the Claude Code Guide
Practical resources selected to help you take the next step.
Open-source galaxy
Projects used in this path
Related articles
Doctolib's cross-verified AI adoption data
Four conference talks and outside sources document Doctolib's AI adoption from 30 engineers to 600, without reducing it to one figure.
FinOps applied to tokens: who owns the AI bill
Cloud FinOps put a cost study first and a named owner for the number second. Three practitioner cases show that sequence applied to token bills.