Campus IA in Fouju: the project in detail
Authorizations, energy, impacts, and opposition: this dossier collects the figures, sources, and open questions around Campus IA in Fouju.
Jump to summary ↓ Florian Bruniaux
Campus IA plans eleven data-center buildings in Fouju, in Seine-et-Marne. The buildings would contain servers, their electrical supply, and cooling systems to provide computing capacity, including for artificial-intelligence services. Here, “campus” means an industrial site rather than a school or university.
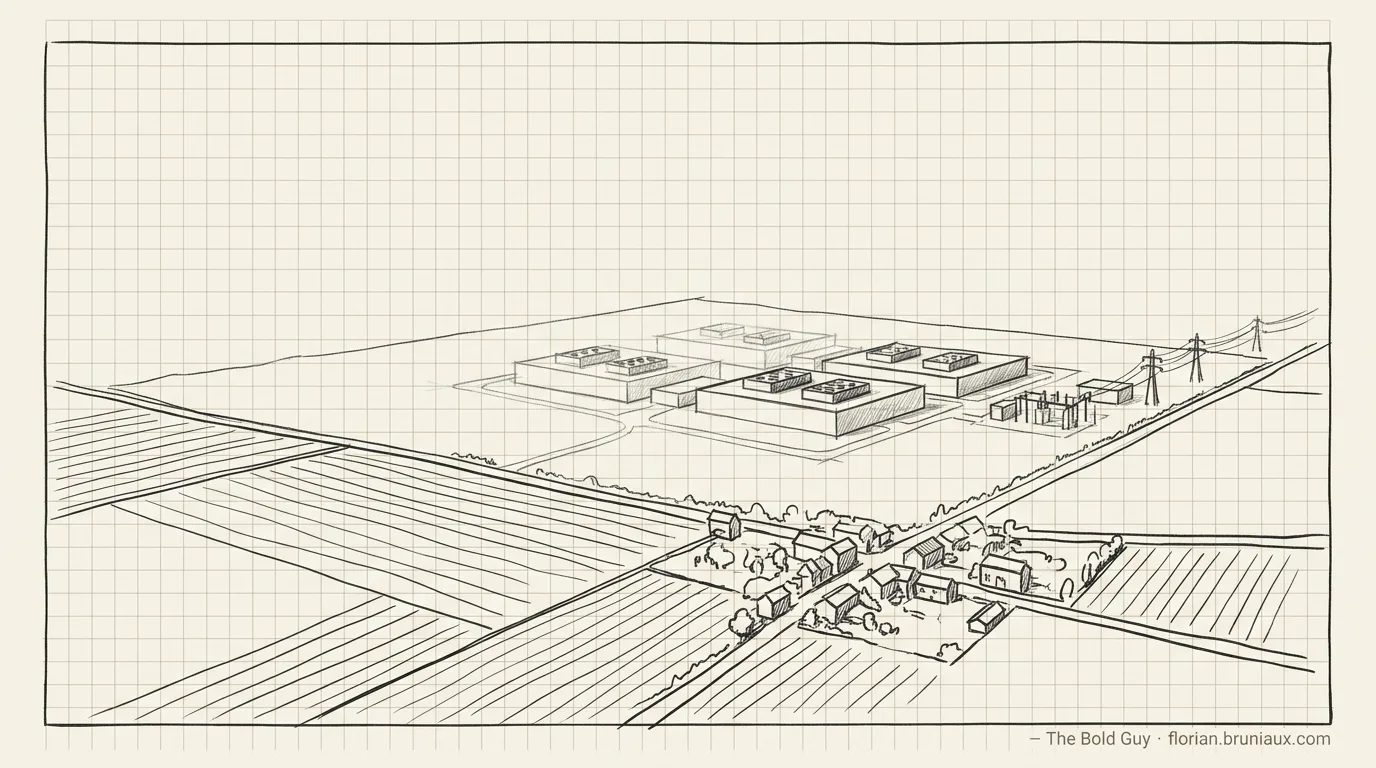
Campus IA is the name of the project. Campus AI is the company behind it. Its participants are MGX, Bpifrance, Mistral AI, and NVIDIA. Fouju has 655 residents and lies southeast of Paris.
On July 29, 2026, the Seine-et-Marne prefect issued the first operating authorizations. They cover DC1, DC2, and DC4, three of the eleven planned buildings. These names identify three buildings on the same campus. None is operating yet. On August 28, the municipality announced the start of phase-one construction, beginning with site fencing, biodiversity-protection measures, and continuing archaeological work.
The French dossier is the factual reference for this series. It distinguishes administrative decisions, developer commitments, estimates, and data that cannot be measured until the site begins operating.
TL;DR
I support the development of data centers in France, and I favor the Campus IA project in Fouju itself, all eleven buildings, on one condition: strict regulation, monitoring over time, and published operating measurements (electricity, water, noise, refrigerant leakage, jobs, tax revenue). Those measurements do not exist yet: the public record contains only authorizations (three buildings out of eleven), developer commitments, and estimates, none of which is an operating result. My final judgment will depend on the first measurements published after commissioning, and I will update this dossier when they exist. I work in AI, and part of my professional activity directly depends on the infrastructure examined here.
Quick access to the dossier
You can read this dossier in order or go directly to the question that interests you. The links below lead to the main definitions, figures, and corresponding sources.
Read the project figures
Two useful definitions
Data centers, power, and energy
What is a data center for?
A data center is a secured building containing servers, storage, networking equipment, and the systems required to keep them running: power distribution, batteries and uninterruptible power supplies, cooling, fire protection, and backup generators. It provides the physical infrastructure behind apparently immaterial services such as websites, cloud platforms, video, messaging, business applications, public services, scientific computing, and artificial intelligence. The US Department of Energy describes data centers as facilities dedicated to computing and digital storage.
Electricity supplies processors, memory, storage, networking, power conversion, security, and cooling. Consumption changes with workload and site efficiency. Grid-connection capacity sets a technical ceiling rather than a constant load.
The units, without jargon
| Unit | What it measures | How to read it |
|---|---|---|
| W, kW, MW, GW | Power at a given instant. Kilo, mega, and giga mean one thousand, one million, and one billion. | 1 GW = 1,000 MW = 1 billion watts. |
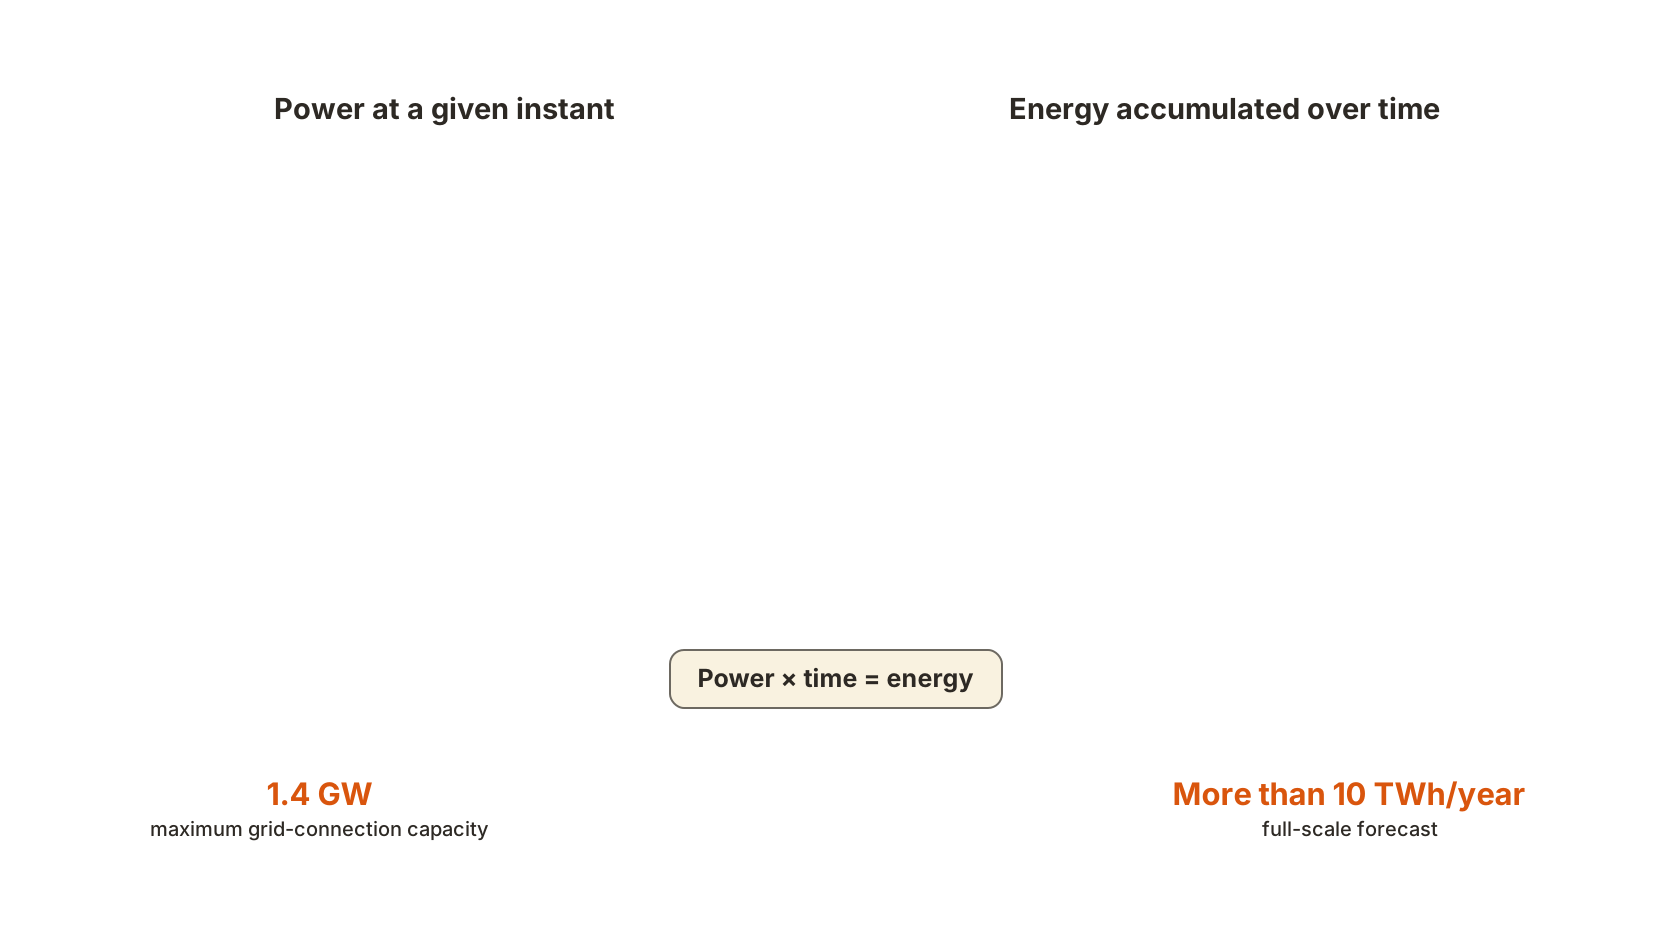
| Wh, kWh, MWh, GWh, TWh | Energy consumed or produced over time. | A 1 MW load running for one hour uses 1 MWh. A constant 1 GW load for one year uses 8.76 TWh. |
| MW IT | Power allocated to computing equipment. | It normally excludes cooling and other building systems. |
| MW or GW of grid capacity | The maximum power the grid connection is designed to supply. | This technical ceiling does not give annual energy use, which is expressed in Wh and its multiples. |
The International Bureau of Weights and Measures defines the watt as a unit of power and the kilo, mega, giga, and tera prefixes. A watt-hour is the energy corresponding to one watt supplied for one hour, under the US Department of Energy definition.
Key figures at a glance
| Topic | Figure or commitment | Evidence status |
|---|---|---|
| Site | Roughly 90 hectares and 11 data-center buildings | Scope described by the regional environmental authority |
| Computing capacity | 848 MW of IT equipment | Scope described by the regional environmental authority |
| Grid connection | Up to 1.4 GW, reached progressively | Campus AI and RTE plan |
| Electricity | More than 10 TWh per year at full scale | Design forecast, not measured |
| Investment | Up to €50 billion for the full development; about €8 billion to €8.5 billion for phase one | Announcement and public-file estimates |
| Cooling and water | Dry, air-based cooling in phase one; no operational withdrawal from the Champigny aquifer | Promoter commitment, not measured |
| Phasing | Three construction periods in the impact assessment; two grid-connection steps; three buildings authorized in July 2026 | Separate schedules that should not be conflated |
| Biodiversity | 61 bird species, two protected amphibian species, nine protected bat species, and 140 plant species inventoried | Impact-assessment inventory cited by the MRAe; effectiveness of measures remains to be measured |
| Refrigerant | 514.3 tonnes of R-1234ze; about 15 tonnes per year under a 3% leakage assumption | Inventory plus modelled leakage |
| Carbon | 38.3 million tonnes of CO2 equivalent over 50 years; arithmetic mean of 0.766 million tonnes per year; 63% attributed to electricity | Impact-assessment estimate cited by the MRAe, which asks for a broader boundary |
| Employment | 500 direct and more than 1,000 indirect jobs estimated at full development; about 1,000 people during construction | Government estimates, not audited outcomes |
Orders of magnitude: what the figures mean
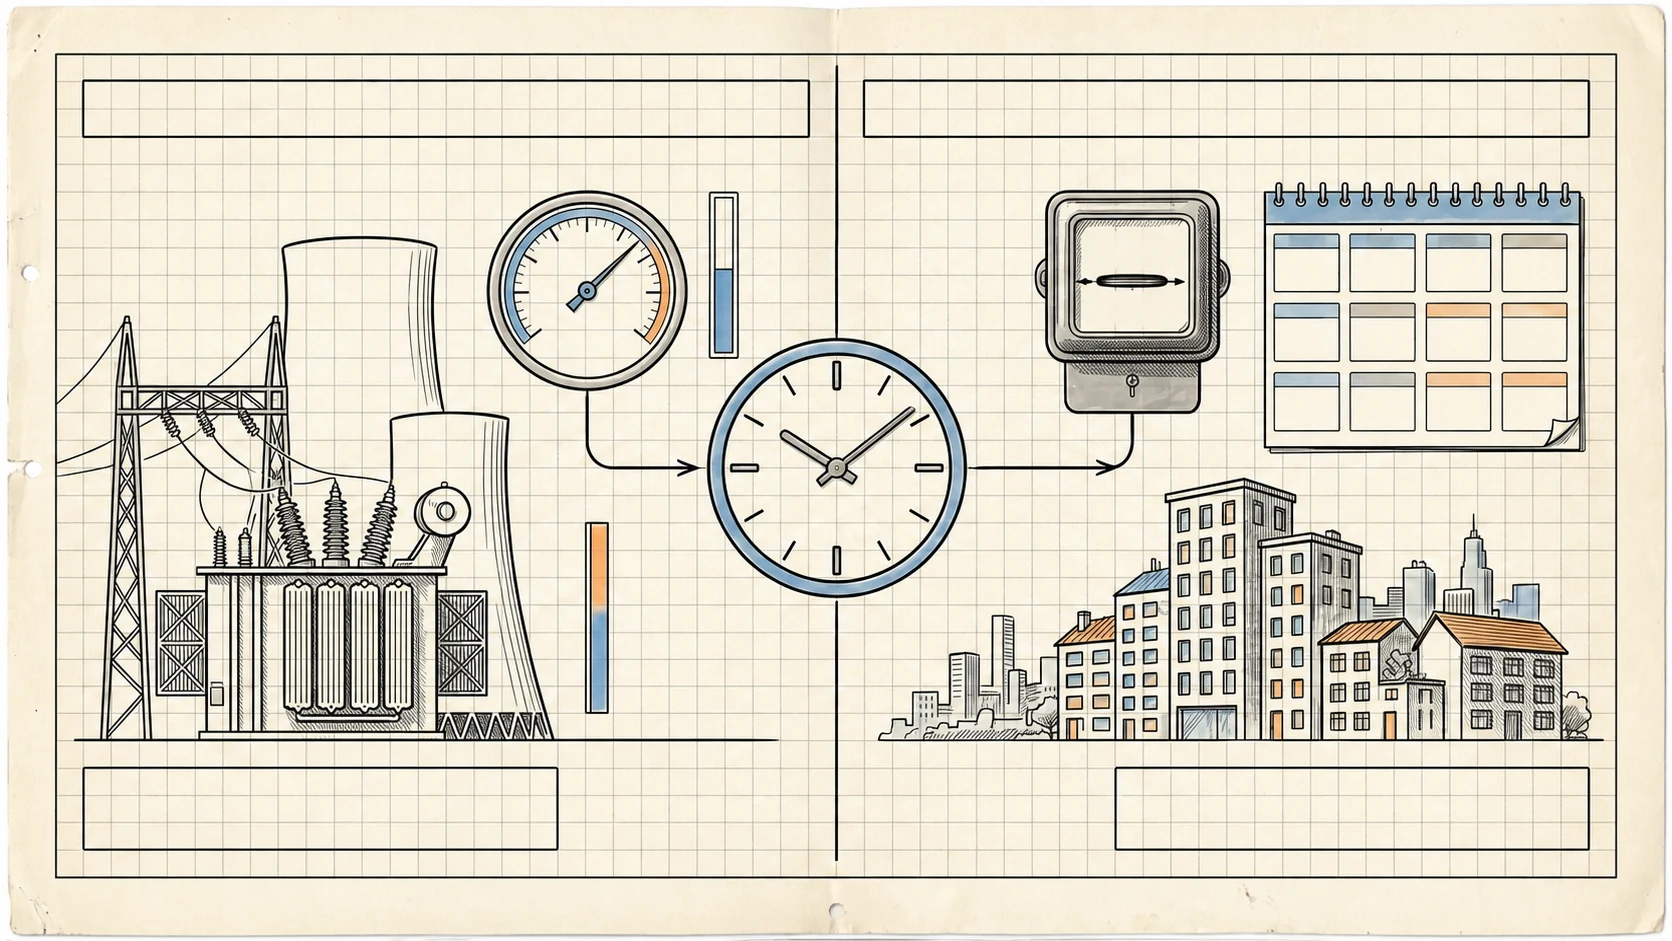
These comparisons translate unfamiliar units into more familiar reference points. They do not make the objects equivalent: a maximum grid connection is not continuous consumption, and two carbon assessments may use different scopes.
| Figure in the filing | Useful order of magnitude | Limit of the comparison |
|---|---|---|
| 1.4 GW maximum grid connection | 1,400 MW. That is close to the nominal output of one French 1,300 to 1,450 MW nuclear reactor, or about 1.6 reactors in the 900 MW class. RTE documents these reactor classes. | This is maximum connection capacity, not measured continuous demand. A nuclear power station may contain several reactors. |
| More than 10 TWh per year | The 10 TWh threshold is 10 billion kWh and an average power of 1.14 GW across one year. It is about 2.2% of France’s climate-adjusted 451 TWh consumption in 2025, or 2.08 million households using the 4,800 kWh annual benchmark cited in the MRAe opinion. Paris reports 28.54 TWh of total energy use in 2022, 42% of it electricity, or about 12 TWh. The 10 TWh threshold is about 83% of that amount. RTE publishes the national total; Paris publishes its territorial energy balance. | This is a minimum full-scale forecast, not a meter reading. The opinion says 200,000 households, but its own footnote uses 4,800 kWh per household; together those inputs produce about 2.08 million, a tenfold discrepancy. The Paris benchmark covers every sector within the city. |
| 514.3 tonnes of R-1234ze inventory | This is the total planned charge held in the closed circuits of 680 cooling units, not annual consumption. The arithmetic average is about 756 kg per unit. | The actual charge varies by equipment. Refrigerant mass alone does not describe toxicity or environmental fate. |
| About 15 tonnes of leakage per year | The filing’s calculation is 514.3 tonnes × 3% = 15.4 tonnes per year across the full campus. | The 3% rate is a modelling assumption. The result is neither an observed rate nor a forecast of regular daily releases. |
| 38.3 MtCO2e over 50 years | The calculation 38.3 ÷ 50 = 0.766 MtCO2e per year is only an arithmetic mean. The 50-year total is 1.99 times Paris’s annual 2022 carbon footprint of 19.27 MtCO2e. In other words, fifty modelled years of Campus IA amount to almost two years of Paris’s 2022 footprint, not twice Paris every year. The 0.766 Mt annual mean is about 4% of that Paris benchmark. Paris documents the boundary and value of its footprint. | The two boundaries are not equivalent. The carbon section details the project model and its exclusions. |
Actors, buildings, and authorizations
Who is behind Campus IA?
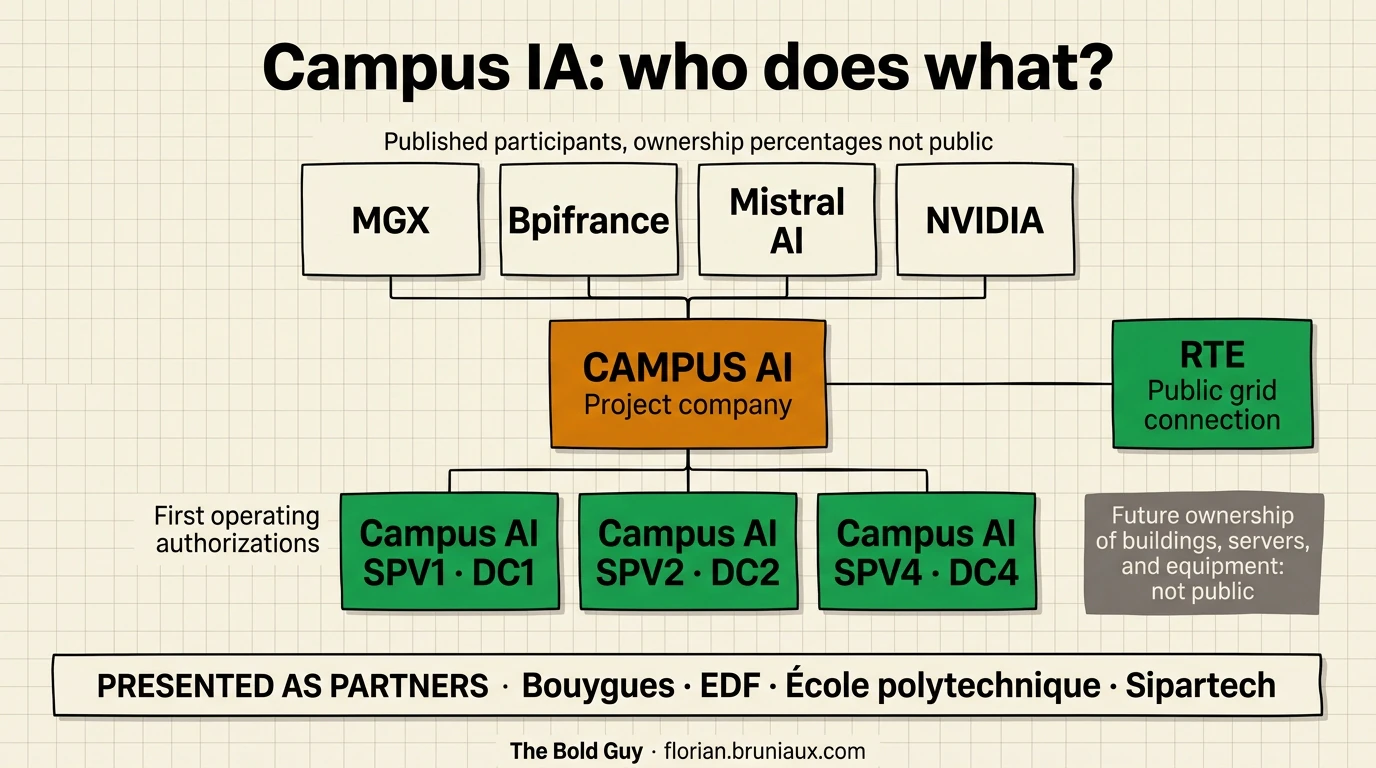
Campus IA is the project’s commercial name. Campus AI is the project company. The official consultation page presents MGX, Bpifrance, Mistral AI, and NVIDIA as the four organizations that make up the company, without publishing their ownership percentages. Bouygues, EDF, École polytechnique, RTE, and Sipartech are presented separately as partners.
The first three operating authorizations concern Campus AI SPV1, Campus AI SPV2, and Campus AI SPV4, the legal operators associated with DC1, DC2, and DC4. RTE leads the public-grid connection. The documents reviewed do not establish who will own each building, server, or item of equipment once the campus is operating.
 Scroll the infographic horizontally
The project currently on record
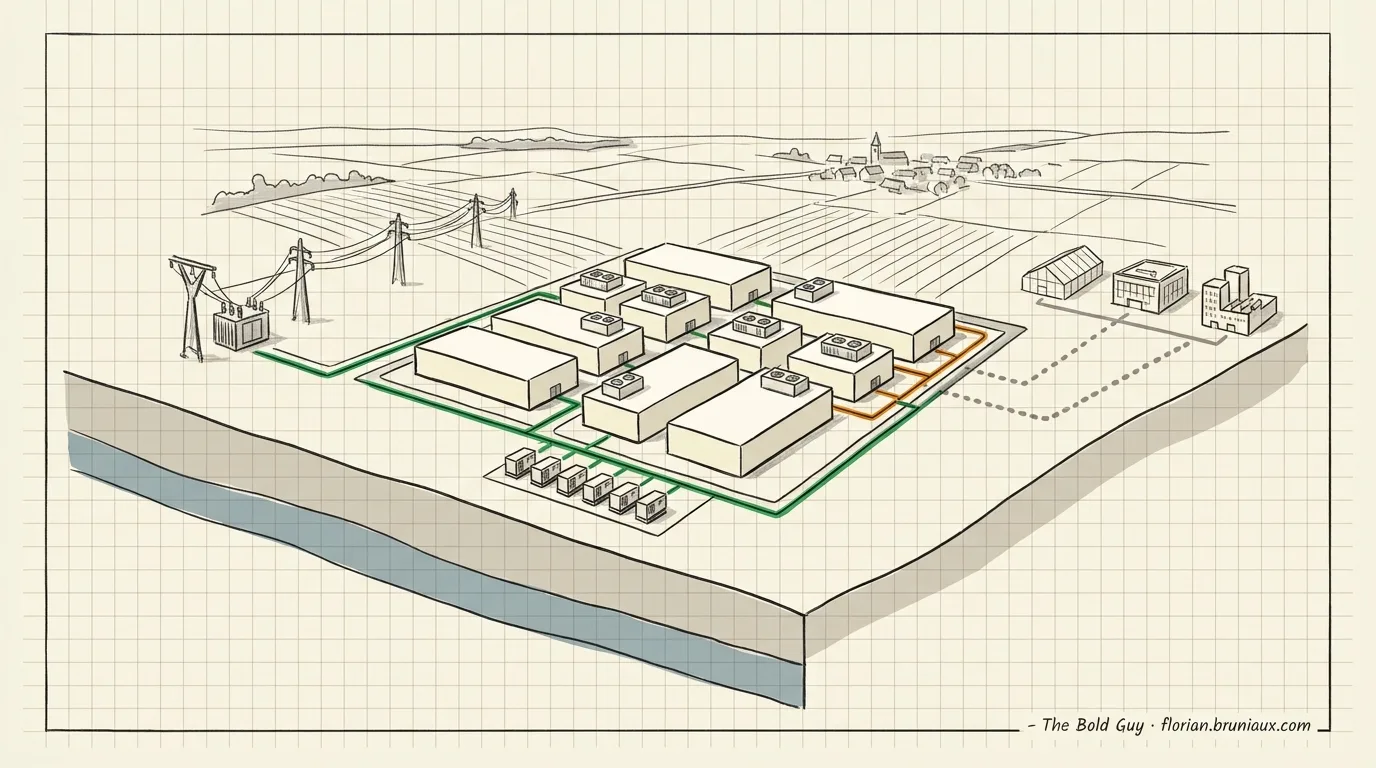
The prefect issued a global water and environmental authorization plus separate operating authorizations for DC1, DC2, and DC4. The regional environmental authority describes a site of roughly 90 hectares on agricultural land, 11 data-center buildings, 680 rooftop cooling units, and 613 emergency generators fuelled with hydrotreated vegetable oil. The MRAe puts the infrastructure and developed footprint at about 48 hectares, including 23 hectares for buildings. The complete design also includes 216 underground tanks, 613 above-ground tanks, and 31,269 tonnes of HVO; those totals cover the full campus, not only the first three authorized buildings.
The construction start announced on August 28, 2026 concerns phase one. Initial work covers site fencing, biodiversity-protection measures, and continuing archaeological excavations. It does not mean that all eleven buildings are authorized or being built at once.
DC1, DC2, and DC4: three buildings, not three technologies
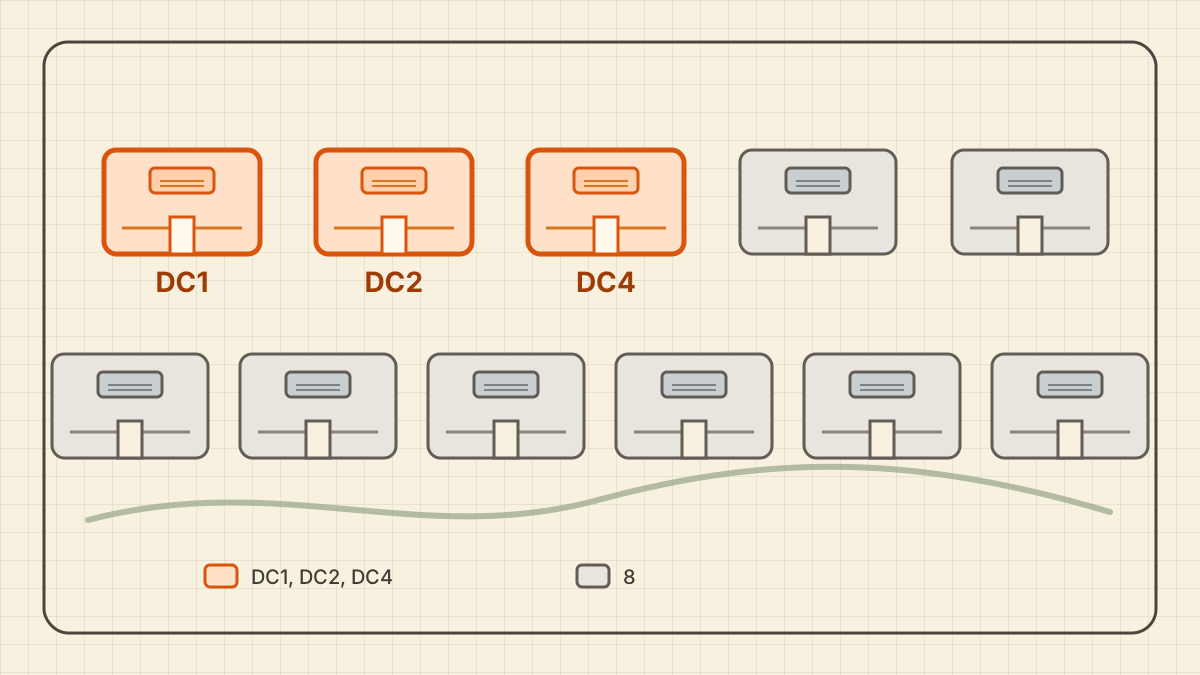
In the public file, “DC” simply means “data center.” The number identifies a building on the master plan. It does not designate a type of server, a technology, or a customer. Each building combines IT rooms on two levels, batteries and uninterruptible power supplies, cooling units on the upper level, emergency generators, and security, storage, and delivery areas.
| Currently authorized building | What the public documents describe | Legal operator |
|---|---|---|
| DC1 | A ground footprint of roughly 2.3 hectares. The environmental authority gives 80 MW of IT capacity and a 130 MW grid connection. The operating order authorizes 75 emergency generators and 75 cooling units containing 22.5 tonnes of R-1234ze in total. | Campus AI SPV1 |
| DC2 | A ground footprint of roughly 1.5 hectares. The operating order authorizes 45 emergency generators and 50 cooling units containing 41 tonnes of R-1234ze in total. | Campus AI SPV2 |
| DC4 | A ground footprint of roughly 2.5 hectares. The operating order authorizes 67 emergency generators and 76 cooling units containing 62 tonnes of R-1234ze in total. | Campus AI SPV4 |
These characteristics come from the prefectural operating orders for DC1, DC2, and DC4, supplemented by the MRAe environmental opinion. Together, the three orders cover 187 emergency generators, 201 cooling units, and 125.5 tonnes of R-1234ze. The figures of 613 generators, 680 cooling units, and 514.3 tonnes refer to the complete 11-building plan.
DC4 therefore does not mean that a fourth building is already operating. The numbering identifies locations in the master plan, not the construction sequence. The schedule reviewed by the MRAe places DC3 in a later phase. It also mentions DC11 in phase one, but the 29 July 2026 operating authorizations cover only DC1, DC2, and DC4.
The exact IT capacity of DC2 and DC4 is not stated in the operating orders reviewed. The campus-wide filing gives only a range of 48 to 96 MW per building. The public documents do not disclose the servers, chips, workloads, or customer assigned to each building either. Mistral is announced as the campus’s first customer, but none of the documents reviewed assigns any of DC1, DC2, or DC4 to Mistral.
The IT capacity, grid connection, and annual electricity forecast are collected in the key figures and explained in the orders of magnitude. The local authority’s project schedule gives 240 MW at the end of 2027, 700 MW around 2030, and full capacity around 2038. Bpifrance says the first services are expected in 2028.
The announced investment also depends on scope. The joint venture’s public announcement refers to as much as €50 billion for the complete development. Public documents put the first phase near €8 billion to €8.5 billion. There is no primary source in the current file for a €10 billion first phase.
Three separate schedules: construction, grid connection, and authorizations
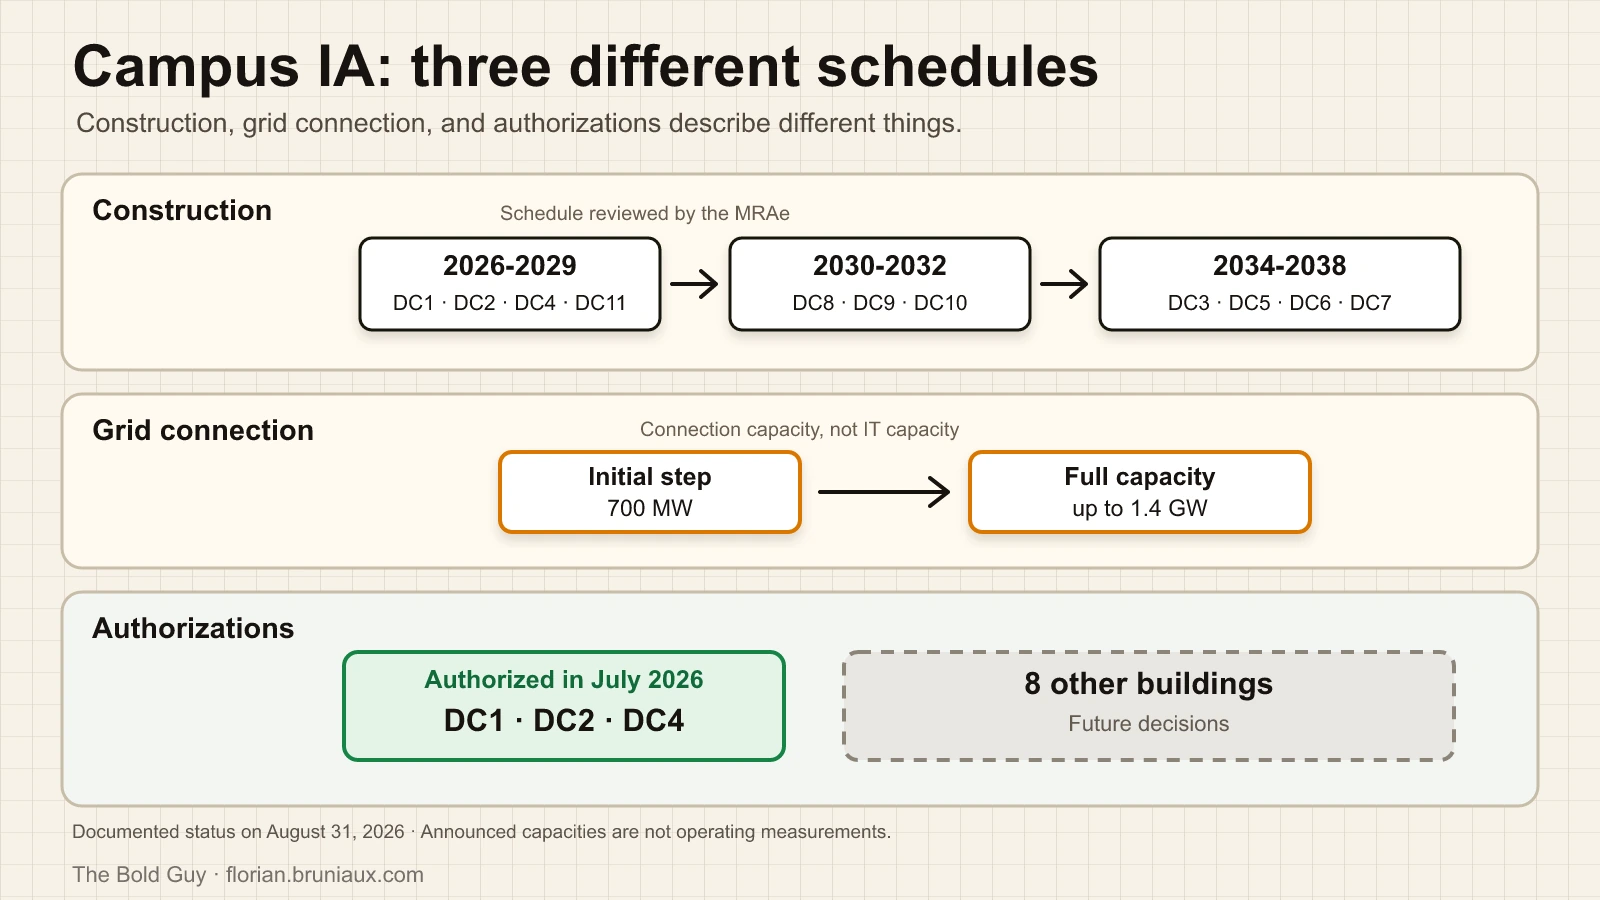
The word “phase” does not identify one common schedule across the public record. This ambiguity explains some of the conflicting claims about what has already been authorized and what remains part of the full development plan.
| Schedule | First step | Later steps | Legal meaning as of August 31, 2026 |
|---|---|---|---|
| Construction schedule reviewed by the MRAe | 2026-2029: DC1, DC2, DC4, DC11, the substation, and the training building | 2030-2032: DC8, DC9, and DC10; 2034-2038: DC3, DC5, DC6, and DC7 | The MRAe opinion reproduces these three periods and identifies inconsistencies between schedules in the filing. They are not three campus-wide authorizations already granted. |
| Grid connection | Initial 700 MW step | Up to 1.4 GW at full capacity | These figures describe connection capacity, not the exact order in which each building will open. |
| Environmental and planning authorizations | One global water authorization and three separate operating authorizations for DC1, DC2, and DC4 | A permit and an operating authorization are planned for each of the eight other buildings | The official inquiry description and the post-consultation commitments show that the other eight buildings still require separate decisions. |
| Cooling and water | Dry cooling announced for the first phase | Study of industrial grey water for some later buildings | This two-step description concerns cooling design. It does not replace the three-period construction schedule. |
The impact assessment addresses the complete project, but the detailed specifications and binding conditions for the other eight buildings will depend on later procedures.
The GreenVoice petition attributes this separation to an attempt to avoid Seveso classification. The record confirms separate operators and orders, but it does not establish that motive. In the public-inquiry commission report, Campus AI relies on the planned use of HVO, distinct operators, and studies reporting no domino effects; the commission considered that response well founded. That administrative assessment does not turn the allegation of avoidance into a demonstrated fact, and it does not prevent a later legal challenge.
Electricity, water, biodiversity, and other impacts
Campus IA electricity use and carbon footprint
National and global context
RTE estimates that French data centers currently use about 10 TWh per year, close to 2% of national electricity consumption. Its 2035 range is 23 to 28 TWh, around 4% of expected demand. ADEME’s separate trend scenario reaches a 3.7-fold increase by 2035 for electricity induced by French data-center uses. The two estimates are not interchangeable because their scopes differ.
At global scale, the International Energy Agency projects data-center electricity consumption rising from about 485 TWh in 2025 to 950 TWh in 2030, or roughly 3% of global electricity demand by then. In that scenario, consumption by AI-focused data centers triples. The IEA video explainer covers global consumption at 1:12 and grid constraints at 3:00. This is a global projection, not a forecast for France or Fouju.
What does 3% of global electricity mean?
| Benchmark | Order-of-magnitude translation |
|---|---|
| 3% of global demand | If the projection materializes, data centers would consume about 1 in every 33 kWh used worldwide in 2030. |
| 950 TWh in one year | This is slightly more than Japan’s current annual electricity consumption, a comparison published by the IEA using its previous 945 TWh projection. |
| 950 TWh compared with France | It is about 2.1 times France’s weather-adjusted 451 TWh consumption in 2025, as reported by RTE. |
| A 465 TWh increase from 2025 to 2030 | The projected increase alone is roughly equal to one full year of French electricity consumption at the 2025 level. |
These comparisons cover annual quantities of electricity only. They do not compare generation mixes, carbon emissions, or the constraints experienced by each local grid.
Campus IA: electricity use and carbon
Campus IA’s filing alone states annual use above 10 TWh at full scale, with the calculation detailed in the orders of magnitude. It would place the site near today’s estimated consumption for the whole French data-center sector, although the comparison will change as other sites open and as Campus IA is phased in.
The modelled assessment presented in the orders of magnitude covers fifty years. The MRAe cites that estimate and its annual arithmetic mean. This division does not describe a full-capacity operating year: construction, the campus ramp-up, and equipment renewal do not produce uniform emissions.
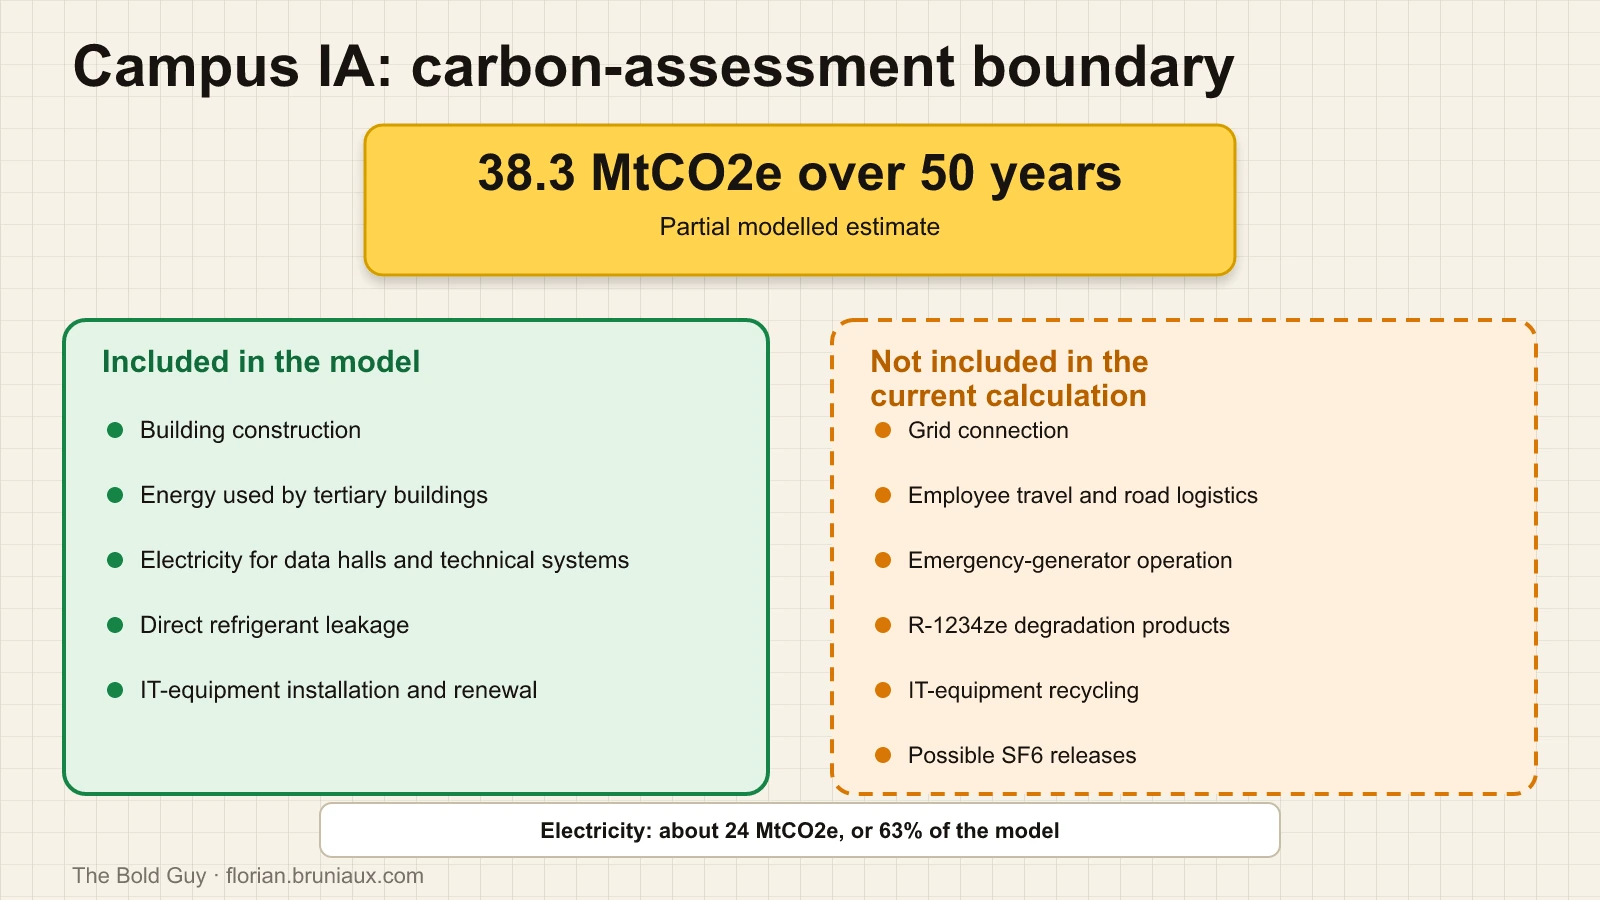
The assessed boundary includes building construction, energy used by tertiary buildings, electricity for data halls and technical systems, direct refrigerant leakage, and the installation and renewal of IT equipment. Electricity accounts for about 24 MtCO2e, or 63% of the model, using a factor of 50 gCO2e/kWh.
The MRAe asks for a consolidated assessment. The current calculation excludes the grid connection, employee and logistics road travel, emergency-generator operation, R-1234ze degradation products, IT-equipment recycling, and possible SF6 releases from electrical equipment.
France’s grid is low-carbon by international standards. RTE’s 2025 balance reports about 20 gCO2/kWh for electricity consumed and 29 g on a lifecycle basis, with much higher values during some hours. A large new load also changes which generators run at the margin. France has no single official marginal emissions constant suitable for every hour of a project lasting decades. The correct conclusion is narrower than either slogan in the public debate: the project’s operational carbon impact is not zero, and its exact future value is not yet measurable.
Water: a design commitment, not an operating measurement
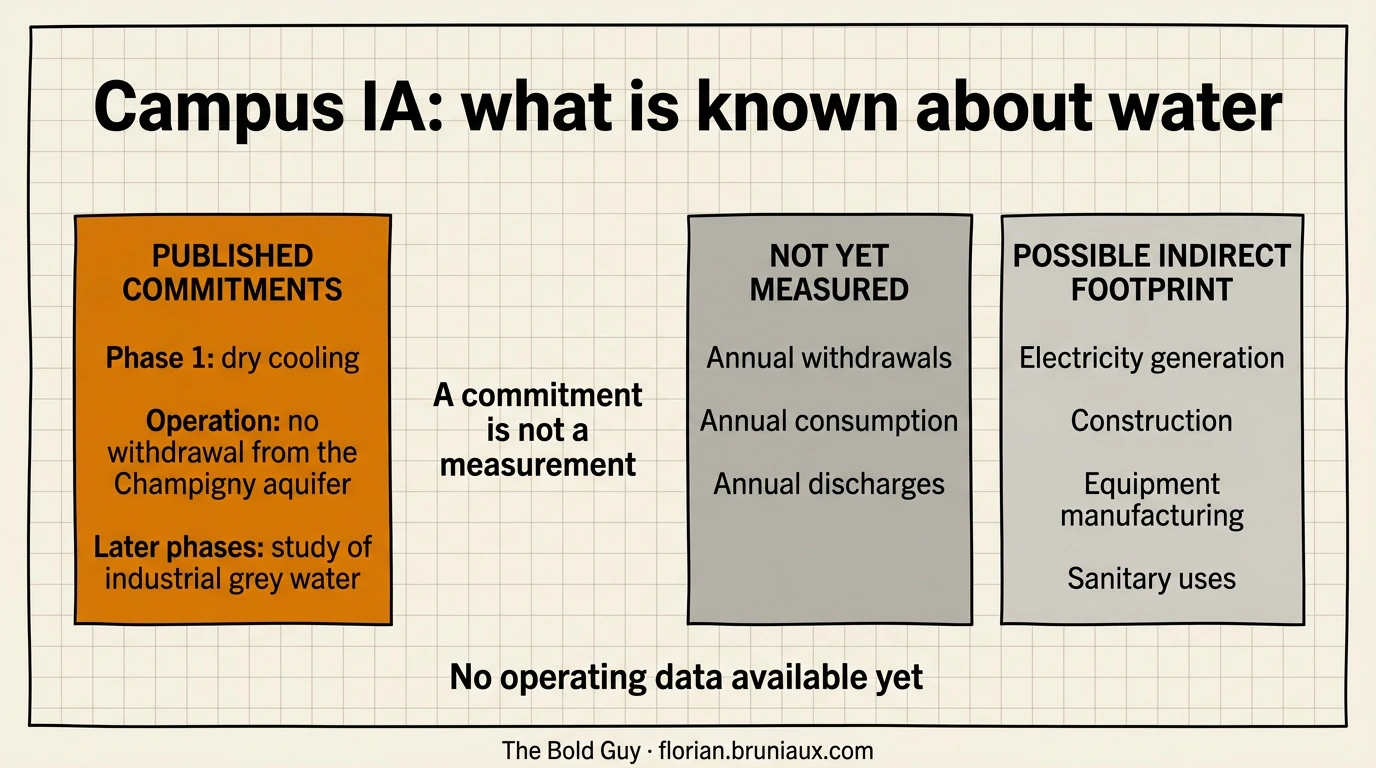
Campus AI has made a written commitment not to draw water from the Champigny aquifer throughout operation. It says the first phase will use dry, air-based cooling and consume no water for that cooling process. For later phases, it has committed only to studying the use of industrial grey water. The post-consultation commitments do not establish that a grey-water supply already exists.
An accounting analysis published by Benoît Petit for Hubblo on August 27, 2026 first distinguishes three flows under a life-cycle-assessment framework. Withdrawn water enters the site, discharged water returns to the environment, and consumed water does not return to the same watershed. For data-center cooling, consumption mainly means evaporation. A discharge may fall outside the consumption figure while its temperature, quality, location, and timing still matter.
Hubblo then separates three parts of the footprint: on-site uses, water consumed to generate electricity, and water linked to construction and equipment manufacturing. WUE(site) covers only the first part by dividing local water consumption by IT-equipment electricity. It excludes the power mix, buildings, servers, and equipment renewal. Dry cooling and no planned aquifer withdrawal therefore address one local part of operation, not the complete water footprint.
The commitments cannot yet be verified against operating data. The site has no annual record of withdrawal, consumption, or discharge. The documents therefore support neither the claim that Fouju is already draining the aquifer nor the claim of a zero water footprint. The second would need to cover electricity generation, construction, equipment manufacturing, sanitation, and any later cooling design.
 Scroll the infographic horizontally
National figures provide context, not a proxy for Fouju. Arcep’s 2026 environmental survey reports 575,000 m³ of direct water withdrawal in 2024 across the 160 data centers in its reporting sample, almost entirely from potable networks. Arcep estimates a much larger footprint after including water associated with electricity generation. Neither figure predicts the consumption of a dry-cooled campus.
Applied to Fouju, Hubblo’s framework calls for separate disclosure of withdrawals, discharges, and net consumption, including source, watershed, and seasonal distribution. WUE(site), water linked to the electricity actually consumed, and assumptions for construction and hardware renewal also need separate accounting. None is yet available as a campus-specific operating measurement.
Two research results explain why generic “water per query” figures are weak evidence for a local project. Li, Yang, Islam, and Ren estimated that training GPT-3 directly consumed about 700,000 litres of freshwater and about 5.4 million litres after adding off-site electricity-related water. Their paper in Communications of the ACM does not include server manufacturing in that 5.4 million-litre figure. A later review by Lei, Lu, Shehabi, and Masanet found workload-level water use varying by more than 10,000 times across combinations of hardware, utilization, cooling, climate, and electricity supply. Location and system design matter more than a universal per-query number.
Biodiversity: a documented inventory with future outcomes to measure
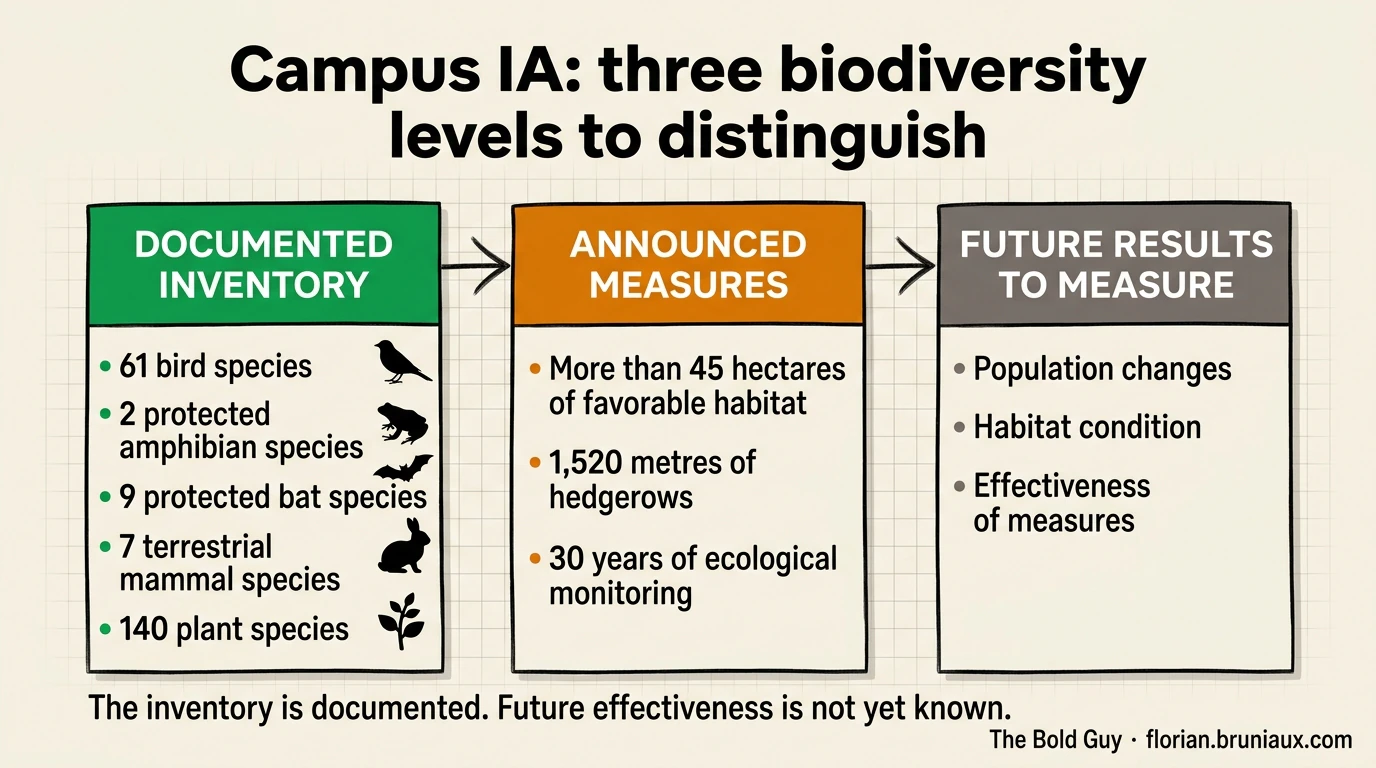
The figures repeated by several opponents do come from the impact assessment. The MRAe opinion of April 8, 2026 lists them and distinguishes the number of species recorded from their protection or conservation status.
| Group | Inventory result | Location or level of concern in the filing |
|---|---|---|
| Birds | 61 species, including 11 heritage nesting species | High concern for birds of open agricultural habitats, including Skylark, Common Quail, Corn Bunting, and Grey Partridge |
| Amphibians | Two nationally protected species: Smooth Newt and Great Crested Newt | Permanent pond on the north-eastern edge; Campus AI says it lies outside the project footprint |
| Bats | Nine species, all protected | Southern hedges, the wooded area, and the pond used for transit and foraging; the study rates the concern as moderate |
| Other mammals | Seven species recorded | European Rabbit is identified as a conservation concern in the south of the site |
| Flora | 140 plant species | Two are conservation concerns, identified in the French filing as Ammi élevé and Vesce à gousses velues |
It would be wrong to say that wildlife was not studied. It would also be too strong to say that the planned measures have already resolved the impacts. The MRAe notes that the first surveys, conducted from May to November 2025, did not cover every season. It asks for stronger evidence that several avoidance and reduction measures will be feasible and effective, particularly for birds. Otherwise, residual effects would need to be reassessed and could require a protected-species derogation and compensatory measures.
During the public inquiry, Campus AI said that it had completed a four-season survey. The promoter describes more than 45 hectares of biodiversity-supporting measures, 1,520 metres of hedges, 30 years of ecological monitoring, and corrective measures if target populations do not develop as expected. The inquiry commission accepted its conclusion that residual effects would be non-significant and that no derogation was required.
The inquiry commission accepted the measures after the promoter’s response, but that administrative conclusion does not establish their effectiveness. Hedges, extensive cultivation, lighting restrictions, and monitoring can be assessed only after implementation. The current absence of a derogation proves neither the absence of protected species nor the future success of the measures.
 Scroll the infographic horizontally
R-1234ze, PFAS, and TFA
The R-1234ze inventory and leakage calculation appear in the orders of magnitude. The environmental authority applies a 3% annual assumption, not an observed rate, and asks for a dedicated health-risk assessment. The facility is not yet operating and the consequences remain uncertain.
For an introduction to its industrial use, Daikin’s manufacturer explainer on R-1234ze describes it as a low-global-warming-potential HFO used in chillers and discusses compressor-size tradeoffs. It explains the technical application, not the refrigerant’s health risk or environmental fate.
R-1234ze falls within the OECD’s 2021 structural definition of PFAS because it contains a fully fluorinated carbon group. That classification does not mean every PFAS has the same toxicity, persistence, or bioaccumulation. ANSES explicitly describes the family as heterogeneous.
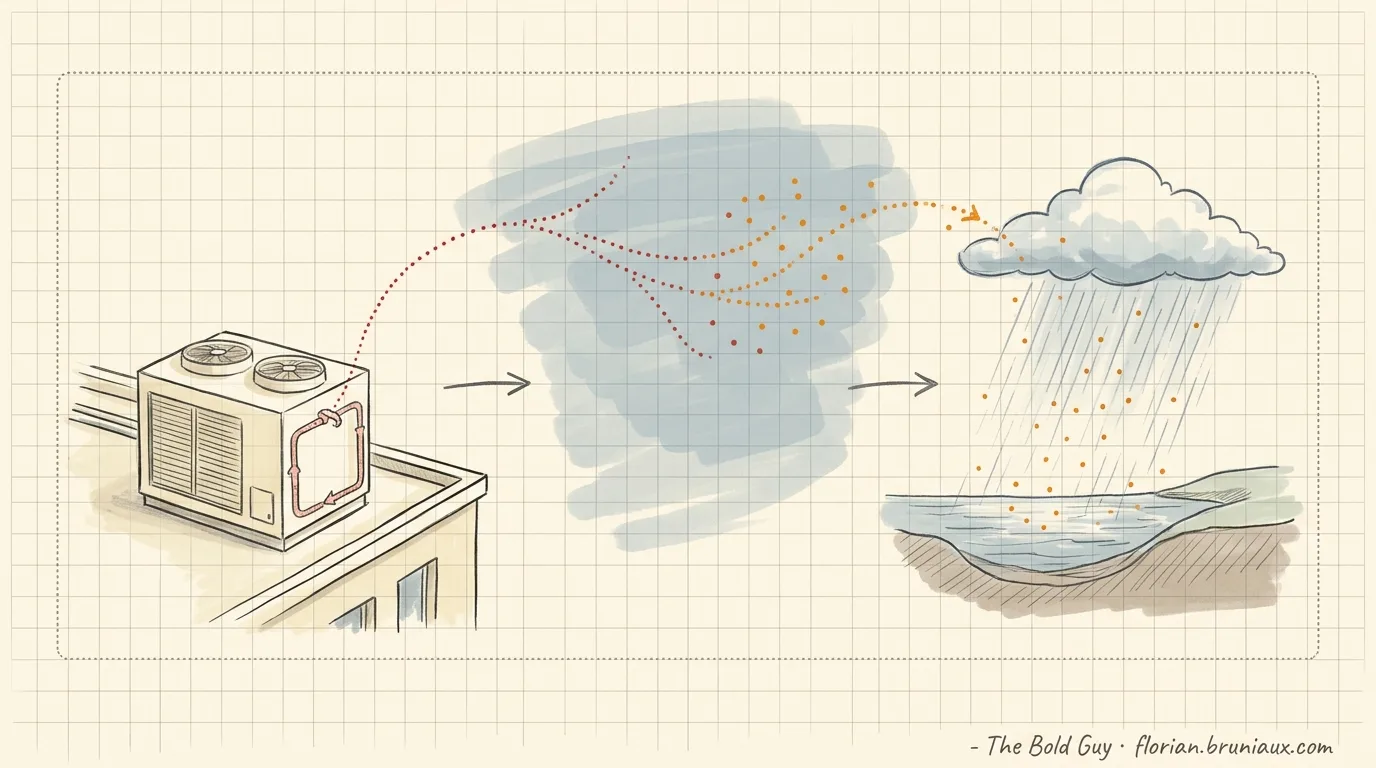
The fluid can degrade in the atmosphere and form trifluoroacetic acid, or TFA. A 2025 atmospheric modelling paper documents this pathway for HFO-1234ze(E). In June 2026, the European Chemicals Agency’s Risk Assessment Committee adopted an opinion recommending harmonised classification of TFA as toxic for reproduction category 1B, persistent, mobile and toxic, and very persistent and very mobile. The ECHA registry records a scientific recommendation, not a completed legally binding EU classification.
The wider European PFAS restriction is also still under review. Its final scope, transition periods, and exemptions are not settled. It is accurate to identify regulatory uncertainty around fluorinated refrigerants. It is not accurate to say that R-1234ze has already been prohibited.
A frequently cited scientific disagreement also needs correction. The Scientists’ Statement on the Chemical Definition of PFASs was published in 2025, not 2023. It supports the OECD structural definition and argues against narrower definitions that would exclude fluorinated gases and TFA. It does not claim that the OECD definition is too broad.
No local contamination or health effect from Campus IA has been measured. The project plans to hold a large refrigerant inventory; the environmental authority has modelled leakage and requested further assessment, while the hazard and restriction processes continue.
Noise, backup generation, and air quality
French ICPE rules set maximum levels of 70 dB(A) during the day and 60 dB(A) at night at the site boundary. In regulated neighbouring areas, the permitted emergence above background noise is 5 or 6 dB(A) during the day and 3 or 4 dB(A) at night. These values come from the ministerial order of January 23, 1997.
What do 60 to 90 dB(A) sound like?
| Approximate level | Everyday reference |
|---|---|
| 30 dB(A) | A quiet bedroom |
| 45 dB(A) | A typical apartment |
| 60 dB(A) | A normal conversation |
| 70 dB(A) | A heavily trafficked street |
| 75 dB(A) | A vacuum cleaner |
| 85 dB(A) | Heavy traffic heard from inside a car |
| 90 dB(A) | A petrol lawn mower or a shouted conversation, depending on the source |
These are rough references from the French Ministry of Health’s noise scale and the World Health Organization’s safe-listening examples. They cannot replace a measurement on site. A television, fan, or car engine does not have one fixed sound level: the model, operating mode, setting, distance, and room all change the result.
The 70 dB(A) limit applies at the site boundary, not inside neighbouring homes, and it does not mean that the campus will continuously produce that level. Emergence above the existing background therefore matters alongside the absolute value. The scale is logarithmic: two identical 70 dB sources produce 73 dB together, not 140 dB. In an unobstructed free field, INRS indicates a drop of about 6 dB each time the distance from the source doubles. Buildings, reflections, and multiple sources can change that relationship on a real site.
The acoustic study examines five noise-sensitive locations where it compares future project noise with the existing background. One is the future Crisenoy prison. This is a separate project planned on neighbouring parcels west of Campus IA. The environmental authority says the limits would be met at most assessed points, but identifies a modelled exceedance of about 0.4 dB(A) at one point north of the future prison and asks for further analysis. Generic sound levels for a hypothetical 5 MW data center cannot replace that local model: equipment, distance, barriers, and measurement conditions all affect the result.
The 613 backup generators create a separate air-quality question. The environmental opinion finds possible nitrogen dioxide exceedances for future prison occupants during maintenance tests and for third-party workers during an emergency scenario. It does not establish routine exposure above World Health Organization thresholds for all on-site employees.
Waste heat: a legal requirement with missing delivery contracts
Since October 1, 2025, French law has required data centers of at least 1 MW to recover and use waste heat when the solution is technically and economically feasible. Sites above 500 kW must also report annual energy-performance data. The Energy Code provides for formal notice and a fine of up to €50,000 if non-compliance continues.
Campus AI has listed several possible users: campus buildings, greenhouses, the planned prison, Melun, and Vaux-le-Vicomte. These are possible outlets, not evidence that a district-heating network, customer contract, financing plan, or delivery date exists. The public record supports an obligation to study and implement viable recovery. It does not yet support a quantified heat-delivery claim.
Jobs and local economic effects
Jobs and local economic effects
The project can affect the local economy through three distinct channels: jobs assigned directly to construction or operations, orders placed with suppliers and subcontractors, and spending by workers and their families. This third channel can support restaurants, accommodation, retail, rentals, and local services. These categories should not be added together as if every job were new, permanent, and local.
| Economic channel | Possible effects around Fouju | What the documents support |
|---|---|---|
| Construction | Civil works, electricity, HVAC, transport, temporary labour, meals, overnight stays, and short-term rentals | A government response estimates that construction will involve about 1,000 people. Annual staffing, assignment duration, and workers’ places of residence have not been published. |
| Direct operations | Data-center technicians, engineers, IT operations, maintenance, security, management, and services | The Government estimates 500 direct and more than 1,000 indirect jobs at full development. No audited reporting yet breaks them down by occupation, employer, phase, or place of residence. |
| Subcontracting | Electrical and cooling maintenance, cleaning, guarding, landscaping, catering, and other services | Campus AI has committed to surveying local firms and structuring construction contracts so they can bid directly or as subcontractors. No quantified local-procurement target or awarded contract has been published. |
| Induced spending | Restaurants, hotels, shops, housing, and services used by workers, contractors, students, and visitors | The effect will depend on how many people stay or live in the area instead of commuting from another employment basin. No local spending study is available. |
Campus AI’s response to the consultation, published in February 2026 explicitly identifies catering and services as possible partnership areas. It also acknowledges that employees, students, and visitors will create accommodation needs. The document mentions hotels and student housing while stating that Campus AI will not build housing or hotels itself. The Brie des Rivières et Châteaux intermunicipal authority is responsible for economic development, tourism, and temporary accommodation, but not housing.
The same distinction applies to schools. Families relocating with children could increase enrolment and support some public services. A locally recruited employee, a daily commuter, and a technician renting a room for several months do not create the same effect. The filing contains no forecast for relocating families, housing programme, or commitment to finance a school. The planned training centre serves a different purpose: technical pathways from technician to engineer level, including digital operations and cybersecurity.
An INSEE study of nuclear plants in the Grand Est region helps explain the mechanism but does not provide a multiplier for Campus IA. It distinguishes indirect jobs supported by supplier purchases from jobs induced by spending by workers and their families. In that specific industrial case, retail, transport, accommodation, food services, public administration, health, education, and social work account for 27% of related employment. Nuclear plants differ from a data-center campus in technology, maintenance requirements, wages, and geography, so that percentage cannot be transferred to Fouju.
Campus IA’s employment estimates have changed with project scope. The government response cited in the table does not support describing 300 to 500 jobs as a verified first-phase total. A 2026 Senate report cites roughly 300 data centers and 50,000 direct and indirect jobs in France. Those national totals do not establish how many jobs Fouju will retain.
To measure the effects instead of assuming them, public reporting should provide full-time equivalents by phase and occupation, contract duration, workers’ places of residence, the value and geographic origin of procurement, and local overnight stays and spending. Without those data, additional activity is plausible and partly documented, but its size and distribution between Fouju, neighbouring municipalities, Melun, and the rest of Île-de-France remain unknown.
Local taxes and electricity prices
The same caution applies to taxes. A gross estimate of roughly €1 million in annual property tax has been attributed to Fouju’s mayor, but the primary basis for that number is not published in the documents reviewed here. The 2026 fiscal agreement says Fouju will retain one third and transfer two thirds to the intermunicipal authority. Other taxes depend on taxable surfaces, ownership, network equipment, transactions, and local tax rules. The public file does not contain an audited annual revenue table by authority.
There is also no measured French household-price effect attributable to Campus IA. International research remains mixed. A 2026 study by Yue and Zeng associates US data-center entry with higher employment, wages, and business creation, concentrated in metropolitan counties, while non-metropolitan counties show little gain. In the subset where electricity prices can be identified more cleanly, the authors find higher rates. Another 2026 US working paper estimates a modest average price decrease from 2015 to 2024, arguing that fixed grid costs and economies of scale can offset new demand. Different methods, geographies, and rate structures produce different answers.
For France, HEC Paris has published a 20% to 40% scenario for dense hubs such as Paris, extrapolated from US data. It is not a French measurement. The French energy regulator’s August 2026 tariff increase was linked to network tariffs and the capacity mechanism, not to a quantified Campus IA effect.
Further studies and hearings
Research and videos for further review
Expand studies, hearings, and videos
Understanding Mistral AI’s role and argument
The resource most directly connected to this question is the May 12, 2026 National Assembly hearing of Arthur Mensch and Audrey Herblin-Stoop. The official HTML transcript makes it possible to check the statements without relying on an edited video: Mensch explains that Mistral hosts models on machines, bills for tokens, and plans its computing infrastructure in megawatts. The most useful passages discuss markets, capital, and public demand at 13:23, the urgency of investment at 31:16, EU regulation at 53:17, the scale of large sites at 55:00, and the reservation of grid capacity at 56:45.
On Campus IA, Arthur Mensch stated in the official parliamentary transcript: “Mistral’s role in the Campus IA project is very minor. We took a very small stake.”1 He then said that Mistral would buy and operate its servers but not manage the buildings, transformers, or cooling. This is Mistral’s account, not a disclosure of the contractual allocation or capital structure.
The hearing helps explain Mistral’s industrial case: keeping GPUs, electricity, data centers, and software capacity in Europe rather than importing the entire service. It still presents the company’s strategy and assumptions. It is neither an independent environmental assessment nor proof that the claimed outcomes for Fouju will materialize.
For a more detailed explanation of what Mistral produces, Arthur Mensch’s May 22, 2024 Senate hearing and its full transcript cover foundation models, training, distribution, and applications. Both hearings are primary sources for Mistral’s position, not independent evaluations of the company.
In a talk at École Polytechnique published in January 2026, also available as a video, Mensch sets out his doctrine rather than Fouju-specific evidence. At 12:00, he argues that AI will not solve climate change and is more likely to worsen it. He then distinguishes three dimensions of sovereignty at 15:53, including industrial sovereignty at 16:18 and information interfaces and democracy at 18:47.
A May 2024 McKinsey interview with Arthur Mensch adds another part of that strategy: the earliest AI firms largely developed in the United States and in English, while Mistral seeks stronger support for French, German, and other European languages. This source clarifies the language argument and Europe’s fragmented market. It does not document an institutional governance role for the Francophonie or establish an economic or environmental effect in Fouju.
The studies below do not all answer the same question. Some measure past conditions, while others build scenarios, assess one AI model, or provide a technical framework. None measures Campus IA in operation.
French and France-linked research
| Source and type | What it adds | Limit for Fouju |
|---|---|---|
| Prospective study of data-center consumption from 2024 to 2060, ADEME, 2026, institutional study | A French baseline and five scenarios through 2060. The study covers electricity, emissions, water pressure, land, sovereignty, and French demand served from abroad. | It is a national prospective model. It predicts neither Campus IA’s actual load nor its local impacts. |
| Reference points for the water footprint of data centers, Benoît Petit for Hubblo, 2026, methodological article in French | It distinguishes withdrawal, consumption, and discharge, then separates on-site, electricity-related, and manufacturing-related water use. It also defines the boundary of WUE(site). | The framework does not measure Campus IA in operation or provide a Fouju-specific estimate. |
| Generative AI: what environmental challenges?, Arcep and PEReN, 2026, institutional report in French | A literature review complemented by PEReN inference tests. It separates data centers, networks, and devices, then model training and use. | It is neither a full life-cycle assessment of Mistral nor a Fouju site study. The tests cover a selection of models and prompts. |
| Territorial recovery of waste heat from data centers, ADEME, 2024, study and technical guides in French | An estimate of France’s heat-recovery potential, stakeholder interviews, and guidance for local authorities and operators. | National potential does not prove that a network, customer, or delivery contract exists in Fouju. |
| Estimating the Carbon Footprint of BLOOM, a 176B Parameter Language Model, Luccioni, Viguier, and Ligozat, 2023, peer-reviewed article | A broader accounting of the training and inference of a large model trained on France’s Jean Zay supercomputer. It shows how strongly the accounting boundary changes the carbon result. | One 176-billion-parameter model on a specific infrastructure and electricity mix is not a proxy for the annual emissions of an 848 MW IT campus. |
European research
| Source and type | What it adds | Limit for Fouju |
|---|---|---|
| Energy Consumption in Data Centres and Broadband Communication Networks in the EU, JRC, 2024, institutional study | A literature- and public-data-based estimate of 45 to 65 TWh for EU data centers in 2022, or 1.8% to 2.6% of EU electricity use. It also documents the shortage of comparable official statistics. | The range describes the EU in 2022. It does not isolate Campus IA and predates the current acceleration in generative-AI investment. |
| Assessment of the energy performance and sustainability of data centres in the EU, European Commission, 2025, first regulatory reporting assessment | An analysis of the first EU reporting cycle for data-center consumption and sustainability indicators. It moves the debate from broad scenarios toward data reported under a common framework. | Coverage and quality depend on the reports received and their completeness. It is not an independent measurement of Fouju. |
| Study on Cloud and AI Development in the EU, European Commission, 2026, commissioned study | An assessment of European computing capacity, future demand, AI-optimized infrastructure, grid and water constraints, permitting, and dependence on non-European suppliers. | It informs European policy choices. It is neither a peer-reviewed paper nor a local environmental assessment. |
| Gone with the clouds: Estimating the electricity and water footprint of digital data services in Europe, Farfan Orozco and Lohrmann, 2023, peer-reviewed article | A scenario model of European electricity and water demand from digital data services through 2030. | Its scope includes internet use and data transmission, not only data centers. Its assumptions predate the current wave of generative-AI projects. |
| Data centres in future European energy systems, Koronen, Åhman, and Nilsson, 2020, peer-reviewed article | An analysis of efficiency, electricity flexibility, waste-heat use, and European policy. It notes that heat recovery mainly works near a suitable district-heating network. | The paper is European, prospective, and predates the generative-AI boom. It verifies no heat customer or contract in Fouju. |
| Impacts of flexible-cooling and waste-heat recovery from data centres on energy systems, Jerez Monsalves, Bergaentzlé, and Keles, 2023, peer-reviewed article | A model of Denmark’s energy system through 2035 that quantifies possible effects of flexible cooling and waste-heat recovery. | Results depend on Danish district heating, electricity markets, and model assumptions. They cannot be transferred directly to Seine-et-Marne. |
Other useful publications
- Making AI Less “Thirsty”, Li, Yang, Islam, and Ren, explains direct and electricity-related water accounting for AI workloads.
- The water use of data center workloads, Lei, Lu, Shehabi, and Masanet, quantifies how hardware, cooling, climate, and power supply can change results by orders of magnitude.
- The Local Economic Effects of AI Data Center Entry, Yue and Zeng, studies US employment, income, business formation, and electricity prices. It is not a French causal estimate.
- Scientists’ Statement on the Chemical Definition of PFASs explains why structural classification and chemical hazard should not be confused.
Four videos cover different parts of the record:
- Campus IA and RTE’s post-consultation webinar presents the promoters’ commitments. It is a first-party source.
- The Crisenoy public meeting records critical researchers and opponents. It documents arguments, not regulatory findings.
- France 24’s May 2026 report provides a short journalistic overview of land, electricity, and water questions around the French expansion.
- BBC World Service’s water explainer interviews Shaolei Ren and explains direct and indirect water use. The useful segments begin at 1:04 for the study and 4:16 for indirect water.
Opposition initiatives and their motivations
Opposition to Campus IA is not one unified movement, nor can it be reduced to a rejection of artificial intelligence. As of August 31, 2026, it includes residents, environmental and farming associations, trade unions, and several political representatives. Their aims range from improving or relocating the project to stopping it entirely.
| Actor or initiative | Documented actions | Stated motivations |
|---|---|---|
| Stop Campus IA | A central resource page, Facebook and Instagram accounts, a press conference, a May 24 picnic, and an August 29 public meeting in Melun. Its GreenVoice petition passed 50,000 signatures on August 26, 2026. | Opposition to the project’s scale, conversion of farmland, electricity demand, potential nuisance, and accelerated procedures. Part of its case also questions the place AI should occupy in society. |
| FNE Seine-et-Marne and FNE Île-de-France | Contributions to public consultations, review of the filing, campaigning, and fundraising for legal costs. FNE Île-de-France says it is preparing several challenges against the authorizations. | Biodiversity, farmland, electricity, air pollution, fluorinated refrigerants, waste heat, cumulative effects, and accessibility of public procedures. No filed-case reference was public in the sources checked by August 31, so this remains an announced action rather than litigation independently verified here. |
| LPO, Confédération paysanne, Les Soulèvements de la Terre, and Solidaires | These organizations took part in collective actions with FNE in May, as reported by Le Monde and Le Parisien. | LPO emphasizes habitats and species; Confédération paysanne focuses on farmland; the other groups extend the critique to extractivism, energy, and the social purpose of digital infrastructure. Joint participation does not mean that all hold identical positions. |
| Mieux vivre à Blandy and Terre de Liens | Mieux vivre à Blandy contributed to the consultation; Terre de Liens Île-de-France submitted an unfavorable opinion during the public inquiry. | Their criticism focuses on the use of farmland and the accumulation of infrastructure locally. Mieux vivre à Blandy recognizes the value of some AI applications while challenging this location and scale. |
| CFDT Île-de-France and critical elected officials | CFDT published a contribution expressing reservations without rejecting the principle. MP Arnaud Saint-Martin organized a public meeting and questioned the government in the National Assembly. | CFDT calls for governance, social dialogue, and employment monitoring. Political criticism also concerns foreign ownership, the strength of the sovereignty claim, electricity opportunity costs, local benefits, and accelerated procedures. |
Fact-checking the GreenVoice petition’s main claims
Show the detailed verificationHide the detailed verification
The petition is a primary source for the collective’s position. It is not an independent technical assessment. The table compares its main claims with the regulatory record available on August 31, 2026.
| Petition claim | Assessment | What the public record shows |
|---|---|---|
| Roughly 90 hectares, with 70 hectares destroyed or artificialized | Partly supported | The surface figures and land type are detailed in the orders of magnitude. Describing the whole area as destroyed natural habitat does not match the mainly intensive farmland recorded in the filing. |
| Eleven data centers, €50 billion, and Europe’s largest project devoted entirely to generative AI | Figures supported, description not demonstrated | The building count and investment scopes are detailed in the project record. No consistent registry establishes the European rank, and official sources do not prove that every future workload will be exclusively generative AI. |
| 1.4 GW and more than 10 TWh per year, equivalent to one nuclear reactor | Real scale, bounded comparison | The two figures and the reactor comparison are explained in the orders of magnitude. They do not describe the same measurement or actual campus demand. |
| Three phases designed to avoid Seveso classification | Separation confirmed, intent not established | The three schedules and regulatory arguments are documented, but the public record does not establish an intent to avoid Seveso rules. |
| No waste-heat solution and a certain local heat-island effect | Too categorical | The filing considers possible users without publishing a customer, network, or delivered volume, as explained in the waste-heat section. A modelled risk is not a measured local temperature increase. |
| 514.3 tonnes of refrigerant used every year and 15 tonnes of inevitable leaks | Incorrect | The R-1234ze, PFAS, and TFA section distinguishes the inventory from the leakage assumption. The filing describes neither annual use of the whole inventory nor an observed or certain release. |
| No overall greenhouse-gas assessment | Incorrect | The carbon section presents the existing estimate and its exclusions. The assessment is incomplete, not absent. |
| 613 generators and more than 30,000 tonnes of HVO | Supported for the complete project | These figures, presented in the project record, are supported for the complete campus. |
| Species inventory cited by the petition | Supported with qualifications | The detailed inventory confirms the cited counts, but protection and conservation categories differ between groups. |
| The lack of a protected-species derogation proves that impacts were ignored | Disputed assessment, not an established fact | The biodiversity section distinguishes the MRAe’s initial request, the promoter’s response, the commission’s decision, and the measures whose effectiveness remains unknown. |
| An imposed inquiry, accelerated procedures, and major-project status | Facts mixed with political judgement | The public inquiry lasted 31 days and Campus IA signed an accelerated grid-connection contract with RTE. The inquiry report states, however, that the project does not have PINM status and that no PINM decree was issued. Calling the procedure a denial of democracy expresses a position, not a legal finding established by its duration. |
Four groups of motivations recur: protecting the territory and biodiversity; deciding how electricity and resources should be allocated; challenging the procedure and asking for stronger democratic oversight; and testing promises about sovereignty, jobs, and tax revenue. Campaign materials are good primary sources for describing what opponents believe, but they do not independently prove their technical claims. When a campaign figure differs from the regulatory filing, this article retains the primary-document value and states the uncertainty.
How to follow the project
| Channel | What it provides | Perspective |
|---|---|---|
| Stop Campus IA | Events, petition, Facebook, Instagram, campaign documents, and possible legal developments. | Collective opposing the project. |
| FNE Seine-et-Marne and FNE Île-de-France on LinkedIn | Environmental analysis, mobilization, and announcements about legal challenges. | Associations opposing the project. |
| Campus IA and its LinkedIn account | Industrial timetable, partnerships, commitments, and developer communications. | First-party sources supporting the project. |
| Fouju municipality and CCBRC | Construction, traffic, local decisions, and practical information for residents. | Local institutional sources that broadly support the project. |
| Seine-et-Marne prefecture | Orders, decisions, inquiry report, and regulatory documents. | Primary legal source. |
| CNDP | Consultation report, submissions, and the developer’s response. The consultation has ended, but the archive remains useful. | Independent public-participation authority. |
| RTE | Milestones and specifications for the grid connection. | Grid operator and joint developer of the connection. |
The most useful monitoring method is to compare at least the opposition collective, the developer, and the prefecture rather than following only one favorable or unfavorable narrative. Social posts show intentions and mobilization; orders and reports establish the decisions that have legally been made.
What remains unknown
Before the campus operates, the public record cannot establish:
- annual metered electricity use and its hourly carbon intensity;
- direct and indirect water consumption under the final cooling design;
- measured refrigerant leakage, TFA deposition, or local health effects;
- measured changes in birds, amphibians, bats, and habitats after the mitigation measures are implemented;
- delivered waste heat, contracted customers, and network economics;
- audited jobs by phase, occupation, residence, and duration;
- the value and geographic origin of procurement, plus local overnight stays and spending linked to construction and operations;
- annual tax receipts retained by each public authority;
- the share of connection and grid reinforcement costs borne by the operator and by other users.
These are the figures that should be tracked after commissioning. Until then, authorizations describe what may be built, promoter commitments describe intended design, and impact studies describe scenarios. They are evidence, but they are not operating results.
My position on the project
I built this dossier from public decisions and studies, developer documents, opposition submissions, scientific papers, parliamentary hearings, and videos. My aim is to separate established facts, estimates, commitments, stakeholder positions, and information that remains unavailable. My position comes after that work, and the facts in this dossier do not depend on it.
I work in AI, and part of my professional activity directly depends on the infrastructure examined here. That explains part of my position, but not all of it. I support the development of data centers capable of sustaining digital services and AI in France.
I am also broadly aligned with the sovereignty case made by Arthur Mensch. Training and operating European models requires Europe to retain the necessary GPUs, energy, data centers, and software capacity rather than importing the entire service. That capacity also affects European languages and control over the interfaces through which information circulates. I still separate this industrial choice from the local assessment: considering this infrastructure useful in France does not settle where or under what conditions it should be built.
That support is not a blank cheque. A project of this scale must be strictly regulated, monitored over time, and assessed through published measurements: actual electricity use, water consumption, backup-generator emissions, noise, refrigerant leakage, delivered waste heat, jobs created, and tax revenue. This support applies to the Fouju project itself, all eleven buildings, under the same conditions. Pre-construction commitments matter, but only transparent operating results can show whether they have been met.
I will therefore follow Campus IA closely and update this article when new verifiable data becomes available. I am also happy to discuss the project, answer technical questions, and speak about these issues at conferences or public meetings. You can contact me if you would like to arrange such a discussion.
Method and sources
The French dossier is the factual register for the overview and both translations. Information falls into four categories:
| Evidence status | What the documents establish | Limit |
|---|---|---|
| Authorization granted | The item appears in prefectural decisions or the environmental filing. | It does not mean the item is already built or operating. |
| Developer commitment | Campus AI or RTE has announced a design or future action. | The commitment has not been verified in operation. |
| Modelled estimate | A calculation applies explicit assumptions to a future scenario. | The value has not been measured on site. |
| Information unavailable | The information is not yet public, contracted, or measurable. | Its absence does not show that the eventual outcome will be positive or negative. |
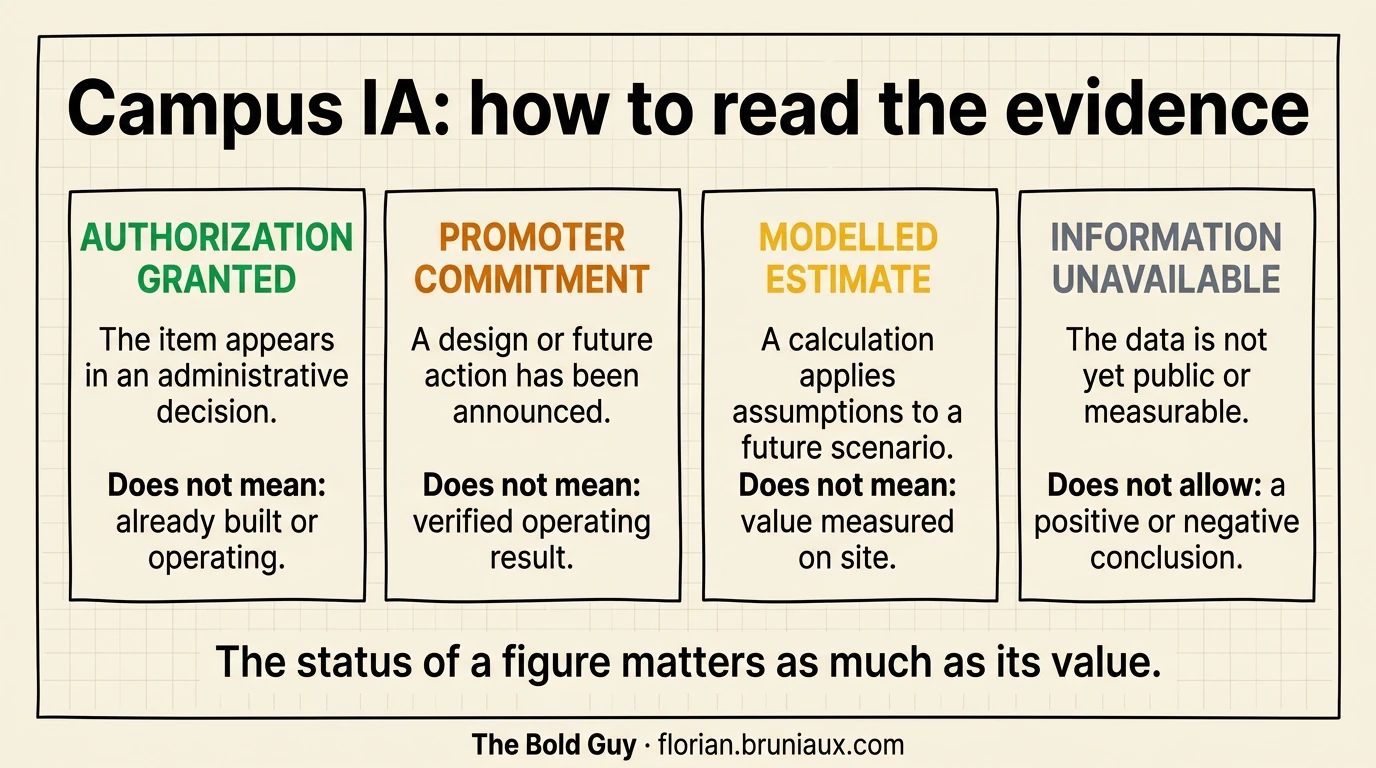 Scroll the infographic horizontally
The main sources are the prefectural decisions, the April 2026 opinion of the regional environmental authority, the public-inquiry commission report, and the commitments published after the public consultation. Supporting studies and comparisons appear in the section where they inform the analysis, together with their scope and limitations.
Appendix: size comparisons in France, Europe, and worldwide
There is no exhaustive global registry that ranks every data center using one consistent measurement. Data Center Map listed 12,259 facilities in 179 countries, including 393 in France, when checked on 31 August 2026. Its entries are primarily maintained by operators and are better suited to locating facilities than measuring their real consumption. In Europe, the EUDCA’s 2026 interactive map compares installed and forecast IT capacity by country. EuroDaCe provides an open map of EU facilities derived from public information and OpenStreetMap.
The following tables are a sample, not an exhaustive league table. They are sorted by the maximum value published by the developer or operator. IT capacity, campus capacity, and grid connection power are not interchangeable. Status is therefore shown separately to distinguish operating infrastructure from construction and announcements.
France
| Site | Maximum published size | Scope of the figure | Public status on 31 August 2026 |
|---|---|---|---|
| Campus IA, Fouju | 848 MW IT and a maximum 1.4 GW grid connection | 11 buildings in the environmental filing; the grid connection does not measure server power alone. | Authorized in phases; DC1, DC2, and DC4 have operating permits but no operating data. |
| DATA4 Escaudain | 700 MW | Full-build capacity announced across 33 hectares. | Project announced on 12 June 2026; the figure is not capacity already in service. |
| DATA4 Paris-Saclay | 505 MW | Published total for PAR01, PAR02, and PAR03: 250, 5, and 250 MW. These are three nearby campuses, not one building. | Aggregate of existing and development capacity; it is not a consumption measurement. |
| Digital Realty Dugny | 176 MW | Three buildings, PAR15, PAR16, and PAR17, with more than 65,000 m² of IT space. | Construction began in 2025; first delivery is announced for 2027. |
| Digital Park Paris | 76 MW or more | Four data centers and 40,000 m² of data-hall space. | The campus is built; its final two phases received LEED certification in 2025. |
Europe excluding France
| Site | Maximum published size | Scope of the figure | Public status on 31 August 2026 |
|---|---|---|---|
| SINES DC, Portugal | 1.2 GW IT | Secured IT capacity for six buildings; SIN02 to SIN06 may each support up to 240 MW. | Phased development through 2030; the capacity announcement is not an operating meter reading. |
| Pure DC Seinäjoki, Finland | 550 MW IT or more | Full campus; phase one provides 110 MW IT. | Phase one is in development and the first building’s substation is live; the full extension remains subject to the required permissions and contracts. |
| Stargate Norway, Narvik | 230 MW, with a proposed 290 MW extension | 230 MW initially and up to 520 MW if the extension proceeds. | Project announced in July 2025 with a published target of 100,000 GPUs by the end of 2026. |
| Ada Docklands, London | 210 MW IT | Three 70 MW buildings. | Construction began in February 2026; the first building is announced for mid-2028. |
| Pure DC Dublin | 54 MW | Three data centers providing 14, 24, and 16 MW. | Campus operating since 2024; a proposed 90 MW extension remains subject to permitting and power. |
Outside Europe
| Site | Maximum published size | Scope of the figure | Public status on 31 August 2026 |
|---|---|---|---|
| Meta Richland Parish, Louisiana | 5 GW of compute capacity | Expansion of Meta’s campus. | Construction began in December 2024; the expansion to 5 GW was announced in July 2026. |
| STACK Stafford, Virginia | 1.1 GW | Four sub-campuses, 19 data centers, and six 300 MW substations. | Campus in development; published capacity is not a measured operating load. |
| The Barn, Michigan | 1 GW | Stargate campus in Saline. | Groundbreaking took place in June 2026; the source contains no operating data. |
| Stargate UAE, Abu Dhabi | 1 GW | Target capacity for the full cluster; first 200 MW tranche. | The May 2025 announcement expected 200 MW in 2026; the source does not confirm that it is operating. |
| Switch Tahoe Reno 1, Nevada | 130 MW | First building on the Citadel campus, separate from the campus’s future total capacity. | The building opened in 2017; the figure is published maximum capacity, not average load. |
The EUDCA’s 2026 report places every facility of 100 MW or more in its highest size band. Campus IA therefore already falls into that band based on its projected IT capacity. Within the band, a comparison remains meaningful only if it preserves both the type of power figure and the project’s status instead of comparing a future grid connection with servers already drawing power.
Footnotes
-
Original French, from the official parliamentary transcript: « Le rôle de Mistral dans le projet Campus IA est très mineur. Nous avons pris une toute petite participation. » The English translation in the text is mine. ↩